So when the server was hanged we took javacore dump on portal node using kill -3 <serverprocessid>. Then i took the javacore.*.txt file and analyzed it using the Thread Dump analyzer following these steps.
- Start the thread dump analyzer and open the javacore.*.txt file. Thread dump analyzer will take couple of minutes then display this UI.
- As you can see the Monitor column is showing 3 open monitors. Monitor is used when your saying using
synchronizedblock or function any where. If you have say static synchronized method then only one thread can enter in it and others would wait to get monitor for that thread - Right click on the javacore file and click on Thread details. The next screen will show details of all the threads running. YOu can see that there are no threads in the deadlock but 255 threads are blocked. That means 255 threads are waiting for something.
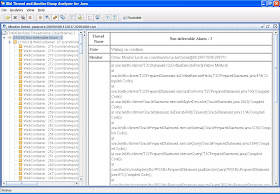
- Now you can go back to the main screen and right click on the javacore and say Monitor detail. It will open a tree view like this
- This view displays which thread is currently running and has monitor and who all is waiting for that monitor. In my case Non-deferrable alarm: 3 thread is running and it owns lock on com/ibm/ws/cache/Cache@ object, which is value of Monitor field on the right hand size. Then under that thread is list of threads waiting to get lock on the cache object. The WebContainer 67 thread is waiting for the lock on that object and there are 218 threads waiting for Monitor that WebContainer 67 owns.
- Conclusion of this issue was that Non-deferrable thread is doing something to block all the web container threads. I looked at the stack trace for that thread on the right hand side to figure out it is doing some database operation. When i scrolled little down i could see my hibernate function that was making JDBC query. This JDBC query was taking really long to return results so i made changes to fix it and that solved my server hang issue


Thanks for the analysis. Its very good.
ReplyDelete