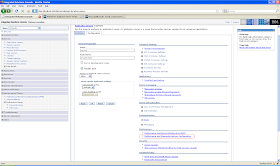
The PADA framework makes use of PMI data so before you start using the tool or make any configuration changes make sure that PMI is enable with suitable collection
You can enable it using WAS Admin console by following these steps. In the WAS Admin Console, go to Servers -> Application Servers -> Server Name. Select the server for which you want to enable the advice and go to its detail page. On the server detail page click on Performance And Diagnostic Advisor Configuration link

Then you have to two options either you can enable Performance and Diagnostic provider, either you can enable it on Configuration tab, which requires server restart to take effect or you can make the changes on the Runtime tab.

After configuring PADA, i wanted to test is so i created a Apache JMeter test that will send request to HelloWorldServlet, which has a doGet() method like this
 protected void doGet(HttpServletRequest request, HttpServletResponse response) throws ServletException, IOException {
  System.out.println("Inside HelloWorldServlet.doGet()");
  HttpSession httpSession = request.getSession();
  System.out.println("File Name " + request.getParameter("fileName"));

  httpSession.setAttribute("testFile", getFileContent(request.getParameter("fileName")));
 getServletContext().getRequestDispatcher("/index.jsp").include(request , response);
 }
As you can see in the doGet() method i am getting HTTPSession object and then storing a file content into the httpSession as session attribute. I used JMeter to generate quite few hits to the HelloWorldServlet and then i started getting the performance advice in the SystemOut.log file like this
[8/31/09 22:34:33:268 PDT] 0000000f TraceResponse W   TUNE0214W: The session cache for HelloWorld#HelloWorldWeb.war is smaller than the average number of live sessions.  Increasing the session cache size to at least 4900.0 may improve performance.
Additional explanatory data follows.
Session cache size (the maximum in memory session count): 1,000.
Current live sessions: 4,900.
Average live sessions over the last sampling interval: 4,900.
This alert has been issued 1 time(s) in a row.  The threshold will be updated to reduce the overhead of the analysis.
You can also look at these tuning advice using WAS Admin Console by going to Troubleshooting -> Runtime Messages -> Runtime Warnings like this

Important: To achieve the best results for performance tuning, start the Performance and Diagnostic Advisor when a stable production level load is running.
No comments:
Post a Comment