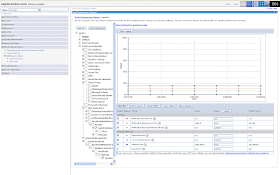
You can debug performance problem by deciding what all performance data you want to look at. Ex. i wanted to see performance of sayHello() method in my HelloWorldEJB and how it relates to performance of HelloWorldServlet. So i selected HelloWorldServlet and sayHello() method of HelloWorldServlet under performance modules and it displayed data about how many times these method were called there response time, how the data relates to each other on time axis,...

In addition to these simple statics you can use TPV to look at all types of data such as how was your data source pool was doing in relation to the spike in Web container thread pool size....
No comments:
Post a Comment