- Start the WebSphere Application Server Toolkit. And once it is started switch to Logging and Performance perspective.
- Right in the Log Navigator perspective and click on Import. In the Import dialog select Profiling and Logging -< Log Files

- Click Next, on the next Import Log Files dialog click on Add button to get Add Log File dialog like this

- On this dialog select type of log as IBM -< WebSphere Application Server -< IBM WebSphere Application Server System Out. In the details section select location of the SystemOut.log file as well as the rules that you want to apply
- The Log analyzer tool will take couple of minutes to parse the log file and finally it will show a screen like this. As you can see it marked the error messages in red and warning messages in yellow

- You can get more information about each of the message by right clicking on message and executing Analyze -> Run. It will take the message identifier for the message and try and find more information in the Symptomps database. And display that information about detail message, possible recommendation,.. on the next screen.

View JVM Logs using Log Analyzer
You can view JVM Logs in Log Analyzer tool, which is part of WebSphere Application Server Toolkit. The Log analyzer will format and display the log in easy to read format.


View JVM Logs using WAS Admin Console
If you dont have access to the file system of where server is installed Ex. you want to view SystemOut.logs for WAS on remote system, then you can use WAS Admin Console. Go to the Runtime tab for JVM Logs and you will get screen like this

On this screen select the log that you want to view by clicking on the View button and it would display the JVM log on next screen like this.


On this screen select the log that you want to view by clicking on the View button and it would display the JVM log on next screen like this.

Analyze JVM Logs
SystemOut.log and SystemErr.log files are text files so you can view them using simple text editor.
The Application server writes formatted messages to the SystemOut.log file and this is how a sample log message looks like
Each entry can be deciphered as follows
The Application server writes formatted messages to the SystemOut.log file and this is how a sample log message looks like
[7/2/09 9:12:22:645 PDT] 00000017 ApplicationMg A WSVR0221I: Application started: SchedulerCalendars
Each entry can be deciphered as follows
- Time Stamp: The first part of the log message in sample code is
[7/2/09 9:12:22:645 PDT]. It is the time stamp when the message was written. The time stamp is formatted using the locale of the process and it is 24 hour time stamp with milli-second precision - Thread ID: The next part in the log message is
00000017, which represents the thread id. The thread ID is an eight-character hexadecimal value that is generated from the hash code of the thread that issued the message - Short name: The short name is the abbreviated name of the component that issued the message. This name is typically the class name of a WAS component and would be some other identifier for the application. In our sample the
ApplicationMgis component name - Event Type: The event type is a one character field that indicates the type of the message. The possible values are
- F- Fatal message
- E- Error message
- W- Warning message
- A- Audit message
- I- Informational message
- C- Configuration message
- D- detail message
- O- Messages that are written directly to System.out by an application or server component
- R- Messages that are written directly to System.err by the user application or internal component.
- Z- Place holder to indicate type was not recognized
In my sample message A indicates this is audit message - Message identifier: The message identifier is a string that is nine characters in length and is in the form CCCC1234X. THe first four characters indicate the WAS component that issues the message. The next four characters indicate the specific message that component is issuing. The last character indicates the severity of the message. Its value is either I- informational, W- Warning or E error. You can find description of all identifiers in the WAS Information center. If your looking at the message in the Rational Application developer console, then each of these message identifier would be displayed as link. Clicking on the link would give details for the message identifier like this.

If not you can get similar details about the message identifier by using Log Analyzer.
- Message: The message is the data that is logged to the SystemOut.log by the component


Configuring JVM Logs
You can configure the JVM logs using WAS Admin Console. Follow these steps in order to do that
- Log into the WAS Admin Console
- Go to TroubleShooting -< Logs and Trace. Select the server/process whose log you want to configure and you will get a screen like this

- Click on JVM Logs to get the JVM Logs Configuration Screen like this
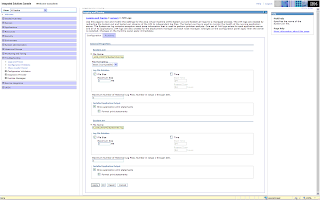
You can configure following parameters on this tab- File Name: The name of a file in the file system. It is recommended that you use a fully qualified file name. If the file name is not fully qualified, it is considered to be relative to the current working directory for the server. Each stream must be configured with a dedicated file. For example, you cannot redirect both System.out and System.err to the same physical file.
- File formatting: Specifies the format to use in saving the System.out file. It is recommended to use the default value of basic format
- Log file rotation: The SystemOut and SystemErr logs are self-managing. They write to the specified file until either the maximum file size or certain time is reached. When that happens the current log file renamed as the current file name plus the current time stamp. Then a new SystemOut and SystemErr file is created for further logging. The older log files are called historical log files.
Depending on your needs you can choose to have the log file rotate when they reach a specified size(Say 5 MB) or certain time(Every morning) or both. - Maximum Number of Historical Log Files. Number in range 1 through 200. The value that is entered here is the number of historical log files that are kept. If the value is reached and another historical log file needs to be created, the oldest one is removed from your system.
- Installed application output: These properties affect how print and println statement from your application are output. There are two options
- Show application print statements: This is enabled by default. If you de select it, application print and println statements are not logged to the SystemOut and SystemErr log file
- Format Print Statement: This is also enabled by default. You can deselect it if you do not want your application print and println statement to be formatted similar to the WAS messages in the log


What is JVM Logs
The WAS application server redirects content
These logs are created for every WebSphere Application Server process, such as deployment manager, node agent, nodes,.. You can find these logs in profiles/<profilename>/logs/<processname> folder.
System.out stream to SystemOut.log and System.err stream to SystemErr.log. The SystemOut.log and SystemErr.log are also known as JVM logs. The WebSphere Application Server writes to this log and you can write into this log from your application by using println(), printStackTrace() callsThese logs are created for every WebSphere Application Server process, such as deployment manager, node agent, nodes,.. You can find these logs in profiles/<profilename>/logs/<processname> folder.
Setting Hang Detection policy using wsadmin script
You can set the hang detection policy using the following admin script
Please note one very important point that
I could not find attribute that allows you to generate javacore on hanged thread.
server = AdminControl.completeObjectName("type=Server,*")
# Print existing values of the attributes to console
print AdminControl.getAttribute(server,"threadMonitorInterval")
print AdminControl.getAttribute(server,"threadMonitorThreshold")
print AdminControl.getAttribute(server,"threadMonitorAdjustmentThreshold")

# Set new attribute values
AdminControl.setAttribute(server,"threadMonitorInterval","70")
AdminControl.setAttribute(server,"threadMonitorThreshold","70")
AdminControl.setAttribute(server,"threadMonitorAdjustmentThreshold","70")
Please note one very important point that
AdminControl object is used for making changes in the runtime environment, so the changes that you make using this script would be effective immediately, and you will loose those changes if you restart the serverI could not find attribute that allows you to generate javacore on hanged thread.
Hang Detection Policy Example
I wanted to try hang detection policy so i decided to create a sample application that will first create hang and then i will use the WAS tools to debug the issue. I followed these steps
- Create a sample HangDetectionServlet as shown in the listing
public class HangDetectionServlet extends HttpServlet {
 private static final long serialVersionUID = 1L;

 protected void doGet(HttpServletRequest request, HttpServletResponse response) throws ServletException, IOException {
  DateFormat d = new SimpleDateFormat("mm:ss:SS");
  response.getWriter().println("Entering HangDetectionServlet.doGet() " + d.format(new Date()));
  try {
   Thread.sleep(250000);
  } catch (InterruptedException e) {
   e.printStackTrace();
  }
  response.getWriter().println("Exiting HangDetectionServlet.doGet()  " + d.format(new Date()));
 }

}
This servlet is very simple, when it gets HTTP GET request it puts the current thread in sleep for 250 seconds. - By default WAS marks a thread has hanged thread if it is running for more than 10 minutes. So our HangDetectionServlet will not be marked as hanged. So in the next step we will change the hang detection policy on WAS so that if the thread is running for more than 60 seconds/ 1 minute it will be considered hanged.
- You can set Hang Detection policy on WAS using WAS Admin Console. First Login into WAS admin console and then go to Servers < Application Servers < server_name. Then under Server Infrastructure go to Administration -> Custom Properties.

- Set hang detection policies like this

By setting value ofcom.ibm.websphere.threadmonitor.thresholdto 60 i am saying that if the thread is running for more than 60 seconds then it should be considered hanged and settingcom.ibm.websphere.threadmonitor.dump.javato true means when application server detects hanged thread it should generate thread dump in addition to writing message in the SysetemOut.log. Setting value ofcom.ibm.websphere.threadmonitor.intervalto 60 means saying that the thread monitor should run every 60 seconds to check for hanged thread. After setting these values restart the server for changes to take effect - Now deploy the HangDetectionServlet on your server and access it, after couple of minutes i could see this message in the SystemOut.log
[7/3/09 13:33:56:375 PDT] 00000019 ThreadMonitor W WSVR0605W: Thread "WebContainer : 0" (00000023) has been active for 66156 milliseconds and may be hung. There is/are 1 thread(s) in total in the server that may be hung.
This message shows thatThread "WebContainer : 0" (00000023)is hanged so lets look at what is causing this thread to hang - If you remember we configured hang detection policy so that it generates thread dump when a thread is hanged. So lets check profiles\AppSrv01\logs\server1\native_stderr.log file to find out if the thread dump was generated and if yes what is the location of the thread dump.
************* End Display Current Environment *************
JVMDUMP007I JVM Requesting Java Dump using 'C:\Cert\WebSphere\AppServer\profiles\AppSrv01\javacore.20090702.231210.3220.0001.txt'
JVMDUMP010I Java Dump written to C:\Cert\WebSphere\AppServer\profiles\AppSrv01\javacore.20090702.231210.3220.0001.txt
The native_stderr.log file has location of the javacore. - Open the javacore.20090702.231210.3220.0001.txt file in
Thread Dump Analyzerwhich is part of the IBM Support Assistant. And inside that take a look at stack trace ofThread "WebContainer : 0" (00000023)thread.
As you can see theThread "WebContainer : 0" (00000023)is executing the HangDetectionPolicy.doGet() method and it is executingThred.Sleep(), so now we know what is causing the thread to hang


Hang Detection Policy
A common error in J2EE applications is a hung thread. A hung thread can result from a simple software defect (such as an infinite loop) or a more complex cause (for example, a resource deadlock). System resources, such as CPU time, might be consumed by this hung transaction when threads run unbounded code paths, such as when the code is running in an infinite loop. Alternately, a system can become unresponsive even though all resources are idle, as in a deadlock scenario. Unless an end user or a monitoring tool reports the problem, the system may remain in this degraded state indefinitely.
Using the hang detection policy, you can specify a time that is too long for unit of work to complete, the thread monitor will monitor all the managed threads and check if any of the thread is running for more than threashold value if yes it will write a message in System.Out to let you know. The hang detection policy is on by default
Important Note: The hang detection policy only monitors managed threads such as web container threads or object request broker (ORB) threads(used for executing EJB). Unmanaged threads, which are created by the application are not monitored.
You can configure the hang detection policy and set following values.
Using the hang detection policy, you can specify a time that is too long for unit of work to complete, the thread monitor will monitor all the managed threads and check if any of the thread is running for more than threashold value if yes it will write a message in System.Out to let you know. The hang detection policy is on by default
Important Note: The hang detection policy only monitors managed threads such as web container threads or object request broker (ORB) threads(used for executing EJB). Unmanaged threads, which are created by the application are not monitored.
You can configure the hang detection policy and set following values.
- com.ibm.websphere.threadmonitor.threshold: The length of time (in seconds) in which a thread can be active before it is considered hung. Any thread that is detected as active for longer than this length of time is reported as hung. The default value is 10minutes or 600 seconds
- com.ibm.websphere.threadmonitor.interval: The frequency (in seconds) at which managed threads in the selected application server will be interrogated. Default value is 180 seconds or 3 minutes
- com.ibm.websphere.threadmonitor.false.alarm.threshold: The number of times (T) that false alarms can occur before automatically increasing the threshold. It is possible that a thread that is reported as hung eventually completes its work, resulting in a false alarm. A large number of these events indicates that the threshhold value is too small. The hang detection facility can automatically respond to this situation: For every T false alarms, the threshold T is increased by a factor of 1.5. Set the value to zero (or less) to disable the automatic adjustment. Default value is 100
- com.ibm.websphere.threadmonitor.dump.java: Set to true to cause a javacore to be created when a hung thread is detected and a WSVR0605W message is printed. The threads section of the javacore can be analyzed to determine what the reported thread and other related threads are doing.
showlog command
Service logs are logs written in a binary format. You cannot view a service log directly using a text editor. You should never directly edit the service log, as doing so will corrupt the log.
The WebSphere Application Server provides two tools that you can use to work with the service log
You can find the
The WebSphere Application Server provides two tools that you can use to work with the service log
- Log Analyzer: This is GUI tool that is part of WebSphere Application Server toolkit
- showlog: This is command line tool that is shipped with WebSphere Application server
You can find the
showlog tool inside the WebSphere/AppServer/bin folder. If you execute it without arguments it will print out help for that tool

c:\WebSphere\AppServer\bin>showlog.bat
This program dumps a Websphere binary log file to standard out or a file.
Usage: showlog [-format CBE-XML-1.0.1] binaryFilename [outputFilename]
where:
        -format specifies the output format.  Currently only CBE-XML-1.0.1 forma
t is supported (this complies with the Common Base Event specification version 1
.0.1).  If no format is given, showlog outputs in a tabular format.

        binaryFilename should be a binary log filename in the WASHOME/logs direc
tory or a fully-qualified binary log filename.  showlog will not look in the cur
rent directory.

        outputFilename is optional.  If no filename is given, showlog dumps bina
ryFilename to standard out.  Otherwise, outputFilename will be created in the cu
rrent directory unless it is a fully-qualified filename.


You can execute the showlog tool by using this command

C:\WebSphere\AppServer\profiles\AppSrv01\bin>showlog.bat c:\WebSphere\
AppServer\profiles\AppSrv01\logs\activity.log c:\temp\activity.log


Wait for this command to finish execution then you can open the c:\temp\activity.log in text editor to look at the activity log. This is sample activity.log from my machine.


ExtendedMessage:
---------------------------------------------------------------
ComponentId:  Application Server
ProcessId:  5492
ThreadId:  00000025
ThreadName:  Non-deferrable Alarm : 5
SourceId:  com.ibm.ws.Transaction.JTA.FailureScopeController
ClassName:
MethodName:
Manufacturer:  IBM
Product:  WebSphere
Version:  Platform 6.1 [BASE 6.1.0.0 b0620.14]
ServerName:  sunpatil-wxp02Node01Cell\sunpatil-wxp02Node01\server1
TimeStamp:  2009-06-29 12:47:44.836000000
UnitOfWork:
Severity:  3
Category:  AUDIT
PrimaryMessage:  WTRN0105I: The transaction service has shutdown successfully with no transactions requiring recovery.
ExtendedMessage:
---------------------------------------------------------------
ComponentId:  Application Server
ProcessId:  5492
ThreadId:  00000025
ThreadName:  Non-deferrable Alarm : 5
SourceId:  com.ibm.ws.runtime.component.ServerCollaborator
ClassName:
MethodName:
Manufacturer:  IBM
Product:  WebSphere
Version:  Platform 6.1 [BASE 6.1.0.0 b0620.14]
ServerName:  sunpatil-wxp02Node01Cell\sunpatil-wxp02Node01\server1
TimeStamp:  2009-06-29 12:47:45.086000000
UnitOfWork:
Severity:  3
Category:  AUDIT
PrimaryMessage:  WSVR0024I: Server server1 stopped
ExtendedMessage:

796 records found and printed.
Debugging Connection leaks
One of the common problems that we uncover during performance testing is JDBC Connection leak. When a J2EE project is using normal JDBC code instead of OR-Mapping framework such Hibernate or Spring there is a good chance that they run into issues that connection was opened but not closed so there is a connection leak.
The code works fine in development environment but in performance environment after some time you start seeing this error Timed Out waiting for connection. This shows problem that some part of your business logic is trying to open a database connection but it is not able to get it.
The IBM Support Assistant tool provides "Database connection pool analyzer" that you can use to debug the connection pool problems. Follow these steps to work with the tool.
The code works fine in development environment but in performance environment after some time you start seeing this error Timed Out waiting for connection. This shows problem that some part of your business logic is trying to open a database connection but it is not able to get it.
[7/2/09 9:53:21:411 PDT] 00000085 AdapterUtil   >  toSQLException Entry
                                 com.ibm.websphere.ce.j2c.ConnectionWaitTimeoutException: Connection not available, Timed out waiting for 180004
 at com.ibm.ejs.j2c.FreePool.createOrWaitForConnection(FreePool.java:1470)
 at com.ibm.ejs.j2c.PoolManager.reserve(PoolManager.java:2141)
 at com.ibm.ejs.j2c.ConnectionManager.allocateMCWrapper(ConnectionManager.java:843)
 at com.ibm.ejs.j2c.ConnectionManager.allocateConnection(ConnectionManager.java:582)
 at com.ibm.ws.rsadapter.jdbc.WSJdbcDataSource.getConnection(WSJdbcDataSource.java:431)
 at com.ibm.ws.rsadapter.jdbc.WSJdbcDataSource.getConnection(WSJdbcDataSource.java:400)
 at com.wpcertification.jdbc.ConnectionLeakServlet.doGet(ConnectionLeakServlet.java:41)
 at javax.servlet.http.HttpServlet.service(HttpServlet.java:743)
 at javax.servlet.http.HttpServlet.service(HttpServlet.java:856)
 at com.ibm.ws.webcontainer.servlet.ServletWrapper.service(ServletWrapper.java:966)
 at com.ibm.ws.webcontainer.servlet.ServletWrapper.handleRequest(ServletWrapper.java:478)
 at com.ibm.ws.wswebcontainer.servlet.ServletWrapper.handleRequest(ServletWrapper.java:463)
 at com.ibm.ws.webcontainer.webapp.WebApp.handleRequest(WebApp.java:3107)
 at com.ibm.ws.webcontainer.webapp.WebGroup.handleRequest(WebGroup.java:238)
 at com.ibm.ws.webcontainer.WebContainer.handleRequest(WebContainer.java:811)
 at com.ibm.ws.wswebcontainer.WebContainer.handleRequest(WebContainer.java:1425)
 at com.ibm.ws.webcontainer.channel.WCChannelLink.ready(WCChannelLink.java:92)
 at com.ibm.ws.http.channel.inbound.impl.HttpInboundLink.handleDiscrimination(HttpInboundLink.java:465)
 at com.ibm.ws.http.channel.inbound.impl.HttpInboundLink.handleNewInformation(HttpInboundLink.java:394)
 at com.ibm.ws.http.channel.inbound.impl.HttpInboundLink.ready(HttpInboundLink.java:274)
 at com.ibm.ws.tcp.channel.impl.NewConnectionInitialReadCallback.sendToDiscriminators(NewConnectionInitialReadCallback.java:214)
 at com.ibm.ws.tcp.channel.impl.NewConnectionInitialReadCallback.complete(NewConnectionInitialReadCallback.java:113)
 at com.ibm.ws.tcp.channel.impl.AioReadCompletionListener.futureCompleted(AioReadCompletionListener.java:152)
 at com.ibm.io.async.AbstractAsyncFuture.invokeCallback(AbstractAsyncFuture.java:213)
 at com.ibm.io.async.AbstractAsyncFuture.fireCompletionActions(AbstractAsyncFuture.java:195)
 at com.ibm.io.async.AsyncFuture.completed(AsyncFuture.java:136)
 at com.ibm.io.async.ResultHandler.complete(ResultHandler.java:193)
 at com.ibm.io.async.ResultHandler.runEventProcessingLoop(ResultHandler.java:725)
 at com.ibm.io.async.ResultHandler$2.run(ResultHandler.java:847)
 at com.ibm.ws.util.ThreadPool$Worker.run(ThreadPool.java:1498)
The IBM Support Assistant tool provides "Database connection pool analyzer" that you can use to debug the connection pool problems. Follow these steps to work with the tool.
- First enable the JDBC Connection pool related trace by enabling trace for the following trace string
WAS.database=finest:WAS.j2c=finest:RRA=finest - Run your load test case and let it generate the
com.ibm.websphere.ce.j2c.ConnectionWaitTimeoutException:error. - Start the IBM Support assistant and then go to Launch Activity -< Analyzer Problem -< Tools.
- Select the Database Connection Pool Analyzer for IBM WebSPhere Application Server and click on launch button. It will ask you for name of the trace file, so select the trace file from your app server that has Connection pool related trace.

- It will open the tool with information on all the data sources in your application server and show how each of them is doing, things like no. of connections used,...
- In my environment i have only one data source
/jdbc/sampleDB, select it and it will show usage graph for that connection along with the MVC wrapper information. - Now select one of the Never Released messages and it will display the stack trace of the connection was never released. Did you notice that it is displaying the stack of calls that were made to get that connection. Now i know that the connection that i am getting in
com.wpcertification.jdbc.ConnectionLeakServlet.doGet(ConnectionLeakServlet.java:41)is never released, so i can make changes to fix that code.


Subscribe to:
Posts (Atom)