- JMX Interface: JMX interface is part of the J2EE specification and the recommended way to gather WebSphere Application Server performance data. PMI data can be gathered from the J2EE managed object MBeans or the WebSphere Application Server PMI Perf MBean. While the J2EE MBeans provide performance data about the specific component, the Perf MBean acts as a gateway to the WebSphere Application Server PMI service, and provides access to the performance data for all the components.
- Performance Servlet: Performance Servlet provides a way to use an HTTP request to query the PMI data for the entire WebSphere Application Server administrative domain. Since the servlet provides the performance data through HTTP, issues such as firewalls are trivial to resolve. The performance servlet outputs the PMI data as an XML document.
- PMI client API (deprecated): PMI client API provides a wrapper class to deliver PMI data to a client. This API was introduced in WebSphere Application Server, Version 4.0 and deprecated in V6.0. The PMI client API uses the JMX infrastructure and the Perf MBean to retrieve the PMI data. PMI client provides the data using a WebSphere Application Server-specific data structure that was introduced in V4.0.
Showing posts with label WASPMI. Show all posts
Showing posts with label WASPMI. Show all posts
PMI Data collection
PMI data collection can occur in three different interfaces


Enable Performance Monitoring
Performance Monitoring Infrastructure (PMI) must be enabled (by default PMI is enabled) before collecting any performance data. PMI should be enabled before the server starts. If PMI is enabled after the server is started, the server needs to be restarted to start the PMI.
You can enable the PMI from either the WAS Admin Console or using wasadmin script. You can enable the PMI from WAS admin console by checking the Enable the Performance Monitoring Infrastructure checkbox like this
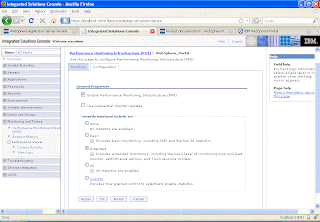
When PMI service is enabled, the monitoring of individual components can be enabled or disabled dynamically. PMI provides four predefined statistic sets that can be used to enable a set of statistics. The following table provides details about the statistic sets. If the predefined statistic sets does not meet your monitoring requirement, the Custom option can be used to selectively enable or disable individual statistics.
Important Note
To monitor performance data through the PMI interfaces, you must first enable PMI through the administrative console before restarting the server. If running in a Network Deployment environment, you must enable PMI on both the server and on the node agent before restarting the server and the node agent.
You can enable the PMI from either the WAS Admin Console or using wasadmin script. You can enable the PMI from WAS admin console by checking the Enable the Performance Monitoring Infrastructure checkbox like this

When PMI service is enabled, the monitoring of individual components can be enabled or disabled dynamically. PMI provides four predefined statistic sets that can be used to enable a set of statistics. The following table provides details about the statistic sets. If the predefined statistic sets does not meet your monitoring requirement, the Custom option can be used to selectively enable or disable individual statistics.
- None All statistics are disabled.
- Basic Statistics specified in J2EE 1.4, as well as top statistics like CPU usage and live HTTP sessions are enabled. This set is enabled out-of-the-box and provides basic performance data about runtime and application components.
- Extended Basic set plus key statistics from various WebSphere Application Server components like WLM and Dynamic caching are enabled. This set provides detailed performance data about various runtime and application components.
- All All statistics are enabled.
- Custom Enable or disable statistics selectively.
Important Note
To monitor performance data through the PMI interfaces, you must first enable PMI through the administrative console before restarting the server. If running in a Network Deployment environment, you must enable PMI on both the server and on the node agent before restarting the server and the node agent.
Tivoli Performance Advisor
The performance advisor in Tivoli Performance Viewer (TPV) provides advice to help tune systems for optimal performance and provides recommendations on inefficient settings by using the collected Performance Monitoring Infrastructure (PMI) data.
You can access the advisor from TPV area in WAS Admin Console. Click on advisor and scroll down in the window, it will list out all the config advise, alerts,warnings. You can filter it to select Config as Severity like this
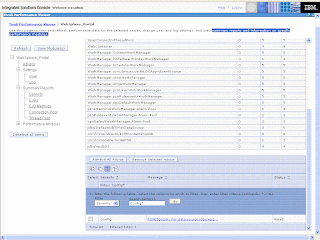
For every advise it will display what config change you should make, how to make that change using WAS Admin Console. This is sample advice that it is generating for tunning jdbc/wpdbDS datasource

Take a look at Using the performance advisor in Tivoli Performance Viewer for details on how to use performance adivsor
You can access the advisor from TPV area in WAS Admin Console. Click on advisor and scroll down in the window, it will list out all the config advise, alerts,warnings. You can filter it to select Config as Severity like this

For every advise it will display what config change you should make, how to make that change using WAS Admin Console. This is sample advice that it is generating for tunning jdbc/wpdbDS datasource

Take a look at Using the performance advisor in Tivoli Performance Viewer for details on how to use performance adivsor
Tivoli Performance Viewer Topology

You can use Tivoli Performaqnce Viewer in either of these two environments
* Tivoli Performance Viewer running in a single server environment
* Tivoli Performance Viewer running in a Network Deployment environment
When the Tivoli Performance Viewer is running in a single server environment, the collection and viewing of the data occurs in the same Java virtual machine. Because the collection and viewing of data occurs in the application server, performance may be affected depending on TPV settings. Viewing Data with the Tivoli Performance Viewer describes the various TPV settings and their effect on performance.
When the Tivoli Performance Viewer is used in a Network Deployment environment, the data is collected at each of the nodes and stored in memory at the node agent. Data is then viewed from the deployment manager. This architecture enables the monitoring work to be distributed among the nodes. Similar to the single server environment, the various user and logging settings directly influence the extent to which performance is affected
What is Performance monitoring infrastructure
Performance monitoring infrastructure (PMI) is the core monitoring infrastructure for WebSphere Application server. The performance data provided by WebSphere PMI helps to monitor and tune application server performance.
When tuning the WebSphere Application Server for optimal performance, or fixing a poorly performing Java 2 Platform, Enterprise Edition (J2EE) application, it is important to understand how the various run time and application resources are behaving from a performance perspective. PMI provides a comprehensive set of data that explains the runtime and application resource behavior. For example, PMI provides database connection pool size, servlet response time, Enterprise JavaBeans (EJB) method response time, Java virtual machine (JVM) garbage collection time, CPU usage, and so on. This data can be used to understand the runtime resource utilization patterns of the thread pool, connection pool, and so on, and the performance characteristics of the application components like servlets, JavaServer Pages (JSP), and enterprise beans.
Using PMI data, the performance bottlenecks in the application server can be identified and fixed. For instance, one of the PMI statistics in the Java DataBase Connectivity (JDBC) connection pool is the number of statements discarded from prepared statement cache. This statistic can be used to adjust the prepared statement cache size in order to minimize the discards and to improve the database query performance. PMI data can be monitored and analyzed by Tivoli Performance Viewer (TPV), other Tivoli tools, your own applications, or third party tools. TPV is a graphical viewer for PMI data that ships with WebSphere Application Server. Performance advisors use PMI data to analyze the run-time state of the application server, and provide tuning advice to optimize the application server resource utilization.
PMI data can also be used to monitor the health of the application server. Some of the health indicators are CPU usage, Servlet response time, and JDBC query time. Performance management tools like Tivoli Monitoring for Web Infrastructure and other third party tools can monitor the PMI data and generate alerts based on some predefined thresholds.
When tuning the WebSphere Application Server for optimal performance, or fixing a poorly performing Java 2 Platform, Enterprise Edition (J2EE) application, it is important to understand how the various run time and application resources are behaving from a performance perspective. PMI provides a comprehensive set of data that explains the runtime and application resource behavior. For example, PMI provides database connection pool size, servlet response time, Enterprise JavaBeans (EJB) method response time, Java virtual machine (JVM) garbage collection time, CPU usage, and so on. This data can be used to understand the runtime resource utilization patterns of the thread pool, connection pool, and so on, and the performance characteristics of the application components like servlets, JavaServer Pages (JSP), and enterprise beans.
Using PMI data, the performance bottlenecks in the application server can be identified and fixed. For instance, one of the PMI statistics in the Java DataBase Connectivity (JDBC) connection pool is the number of statements discarded from prepared statement cache. This statistic can be used to adjust the prepared statement cache size in order to minimize the discards and to improve the database query performance. PMI data can be monitored and analyzed by Tivoli Performance Viewer (TPV), other Tivoli tools, your own applications, or third party tools. TPV is a graphical viewer for PMI data that ships with WebSphere Application Server. Performance advisors use PMI data to analyze the run-time state of the application server, and provide tuning advice to optimize the application server resource utilization.
PMI data can also be used to monitor the health of the application server. Some of the health indicators are CPU usage, Servlet response time, and JDBC query time. Performance management tools like Tivoli Monitoring for Web Infrastructure and other third party tools can monitor the PMI data and generate alerts based on some predefined thresholds.
Subscribe to:
Posts (Atom)