
Showing posts with label portletpmi. Show all posts
Showing posts with label portletpmi. Show all posts
Portal level PMI
In addition to the portlet level PMI data, the WPS 6.1 server can also collect some portal level data. You can enable it by checking wpsModules check box. When i enabled it i can see quite a lot of portal level matrix such as % time spent in portlet code or in aggregation code. But the data is not getting updated. NOt sure if i have to follow some additional steps.

Portlet PMI
Starting from WAS 6.1, The Tivoli performance viewer lets you capture the Performance monitoring data for the portlet. Take a look at this screen, You can enable the PMI for particular portlet by selecting that portlet under Performance Module -> Web Applications when you expand the web application if it has portlet then it will display additional check boxes for capturing PMI for that portlet or portlet application. Once you enable it, you can see the PMI data that TPV is capturing for portlet

- Response time of portlet render: REsponse time for the portlets render method that means time spent in either of do***() method
- Response time of portlet action: REsponse time for the portlets processAction() method
- Response time of a portlet processEvent request: REsponse time for the portlets processEvent() method
- Response time of a portlet serveResource request: REsponse time for the portlets serveResource() method.
Demonstrate enabling Portlet PMI
Debugging performance problems in WebSphere Portal is really difficult. Lets one of your page is taking long time to render that page has 3 portlets. How do you find out which portlet is creating problem. The WebSphere Application Server provides way to find out how much time does portlet take to process action, render or resource request. By default these metrics are disabled but you can enable them by following these steps.
- Log Into the WebSphere Application Server Admin Console.
- Go to Monitoring and Tunning -> Performance Monitoring Infrastructure page. Check if "Enable Performance Monitoring Infrastructure " is checked or not. If not check it and restart server.

- Once the Performance monitoring is enabled, next step would be to enable portlet specific metrics. So Select the Custom radio button on Performance Monitoring Infrastructure page and click on Custom link. It will take you to the Custom Monitoring Level page.
Switch to runtime tab so that the changes that you make become effective immediately. Click On WebSphere Portal ->Web Applications. It will show you quite few metrics that are available at web application level. Select the Portlet related metrics and click on Enable button. You can disable everything else. At end filter records to check what all metrics are enabled. You should see all portlet related metrics in the list like this
- Now lets enable the portlet metrics only for the portlets on your test page.
- On the WAS Admin Console go to Monitoring and Tuning -> Performance Viewer -> Current Activity. Select the WebSphere Portal. You should see the current performance metrics.
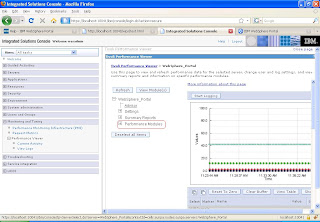
- Click on Performance Modules -> Web Application. It will list out all the .war files installed on your portlet. Only the portlets that you have accessed so far would be enabled. Select the war files that your interested in expand it, it should list out all the portlets in that application. Select the one that your intereste in. I am selecting XHRSample portlet

- Similar select portlet metrics for other portlets on that page.
- Once portlet related metrics are enable go to portal page and hit it few times or may be you can run your load test.
- Now comeback to WAS Admin Console click on Current activity and you should see the performance data like this.


Take a look at Exploiting the WebSphere Application Server V6.1 portlet container for more information on Enabling Portlet PMI.
Subscribe to:
Posts (Atom)