- Create a sample HangDetectionServlet as shown in the listing
public class HangDetectionServlet extends HttpServlet {
 private static final long serialVersionUID = 1L;

 protected void doGet(HttpServletRequest request, HttpServletResponse response) throws ServletException, IOException {
  DateFormat d = new SimpleDateFormat("mm:ss:SS");
  response.getWriter().println("Entering HangDetectionServlet.doGet() " + d.format(new Date()));
  try {
   Thread.sleep(250000);
  } catch (InterruptedException e) {
   e.printStackTrace();
  }
  response.getWriter().println("Exiting HangDetectionServlet.doGet()  " + d.format(new Date()));
 }

}
This servlet is very simple, when it gets HTTP GET request it puts the current thread in sleep for 250 seconds. - By default WAS marks a thread has hanged thread if it is running for more than 10 minutes. So our HangDetectionServlet will not be marked as hanged. So in the next step we will change the hang detection policy on WAS so that if the thread is running for more than 60 seconds/ 1 minute it will be considered hanged.
- You can set Hang Detection policy on WAS using WAS Admin Console. First Login into WAS admin console and then go to Servers < Application Servers < server_name. Then under Server Infrastructure go to Administration -> Custom Properties.

- Set hang detection policies like this

By setting value ofcom.ibm.websphere.threadmonitor.thresholdto 60 i am saying that if the thread is running for more than 60 seconds then it should be considered hanged and settingcom.ibm.websphere.threadmonitor.dump.javato true means when application server detects hanged thread it should generate thread dump in addition to writing message in the SysetemOut.log. Setting value ofcom.ibm.websphere.threadmonitor.intervalto 60 means saying that the thread monitor should run every 60 seconds to check for hanged thread. After setting these values restart the server for changes to take effect - Now deploy the HangDetectionServlet on your server and access it, after couple of minutes i could see this message in the SystemOut.log
[7/3/09 13:33:56:375 PDT] 00000019 ThreadMonitor W WSVR0605W: Thread "WebContainer : 0" (00000023) has been active for 66156 milliseconds and may be hung. There is/are 1 thread(s) in total in the server that may be hung.
This message shows thatThread "WebContainer : 0" (00000023)is hanged so lets look at what is causing this thread to hang - If you remember we configured hang detection policy so that it generates thread dump when a thread is hanged. So lets check profiles\AppSrv01\logs\server1\native_stderr.log file to find out if the thread dump was generated and if yes what is the location of the thread dump.
************* End Display Current Environment *************
JVMDUMP007I JVM Requesting Java Dump using 'C:\Cert\WebSphere\AppServer\profiles\AppSrv01\javacore.20090702.231210.3220.0001.txt'
JVMDUMP010I Java Dump written to C:\Cert\WebSphere\AppServer\profiles\AppSrv01\javacore.20090702.231210.3220.0001.txt
The native_stderr.log file has location of the javacore. - Open the javacore.20090702.231210.3220.0001.txt file in
Thread Dump Analyzerwhich is part of the IBM Support Assistant. And inside that take a look at stack trace ofThread "WebContainer : 0" (00000023)thread.
As you can see theThread "WebContainer : 0" (00000023)is executing the HangDetectionPolicy.doGet() method and it is executingThred.Sleep(), so now we know what is causing the thread to hang
Showing posts with label threaddumpanalyzer. Show all posts
Showing posts with label threaddumpanalyzer. Show all posts
Hang Detection Policy Example
I wanted to try hang detection policy so i decided to create a sample application that will first create hang and then i will use the WAS tools to debug the issue. I followed these steps


Hang Detection Policy
A common error in J2EE applications is a hung thread. A hung thread can result from a simple software defect (such as an infinite loop) or a more complex cause (for example, a resource deadlock). System resources, such as CPU time, might be consumed by this hung transaction when threads run unbounded code paths, such as when the code is running in an infinite loop. Alternately, a system can become unresponsive even though all resources are idle, as in a deadlock scenario. Unless an end user or a monitoring tool reports the problem, the system may remain in this degraded state indefinitely.
Using the hang detection policy, you can specify a time that is too long for unit of work to complete, the thread monitor will monitor all the managed threads and check if any of the thread is running for more than threashold value if yes it will write a message in System.Out to let you know. The hang detection policy is on by default
Important Note: The hang detection policy only monitors managed threads such as web container threads or object request broker (ORB) threads(used for executing EJB). Unmanaged threads, which are created by the application are not monitored.
You can configure the hang detection policy and set following values.
Using the hang detection policy, you can specify a time that is too long for unit of work to complete, the thread monitor will monitor all the managed threads and check if any of the thread is running for more than threashold value if yes it will write a message in System.Out to let you know. The hang detection policy is on by default
Important Note: The hang detection policy only monitors managed threads such as web container threads or object request broker (ORB) threads(used for executing EJB). Unmanaged threads, which are created by the application are not monitored.
You can configure the hang detection policy and set following values.
- com.ibm.websphere.threadmonitor.threshold: The length of time (in seconds) in which a thread can be active before it is considered hung. Any thread that is detected as active for longer than this length of time is reported as hung. The default value is 10minutes or 600 seconds
- com.ibm.websphere.threadmonitor.interval: The frequency (in seconds) at which managed threads in the selected application server will be interrogated. Default value is 180 seconds or 3 minutes
- com.ibm.websphere.threadmonitor.false.alarm.threshold: The number of times (T) that false alarms can occur before automatically increasing the threshold. It is possible that a thread that is reported as hung eventually completes its work, resulting in a false alarm. A large number of these events indicates that the threshhold value is too small. The hang detection facility can automatically respond to this situation: For every T false alarms, the threshold T is increased by a factor of 1.5. Set the value to zero (or less) to disable the automatic adjustment. Default value is 100
- com.ibm.websphere.threadmonitor.dump.java: Set to true to cause a javacore to be created when a hung thread is detected and a WSVR0605W message is printed. The threads section of the javacore can be analyzed to determine what the reported thread and other related threads are doing.
Using Thread dump analyzer to detect server hang/ Server Crash
Recently i was debugging one server crash problem during performance testing. So what was happening is the code was running ok during manual testing but once we started performance testing and have 200 users hitting portal every minute after 30 minutes of so server was getting hanged and stopped responding. When i looked at the SystemOut i could see the WebContainer thread hanged message (I think WebSphere VE is generating that alert).
So when the server was hanged we took javacore dump on portal node using kill -3 <serverprocessid>. Then i took the javacore.*.txt file and analyzed it using the Thread Dump analyzer following these steps.
So when the server was hanged we took javacore dump on portal node using kill -3 <serverprocessid>. Then i took the javacore.*.txt file and analyzed it using the Thread Dump analyzer following these steps.
- Start the thread dump analyzer and open the javacore.*.txt file. Thread dump analyzer will take couple of minutes then display this UI.

- As you can see the Monitor column is showing 3 open monitors. Monitor is used when your saying using
synchronizedblock or function any where. If you have say static synchronized method then only one thread can enter in it and others would wait to get monitor for that thread - Right click on the javacore file and click on Thread details. The next screen will show details of all the threads running. YOu can see that there are no threads in the deadlock but 255 threads are blocked. That means 255 threads are waiting for something.

- Now you can go back to the main screen and right click on the javacore and say Monitor detail. It will open a tree view like this

- This view displays which thread is currently running and has monitor and who all is waiting for that monitor. In my case Non-deferrable alarm: 3 thread is running and it owns lock on com/ibm/ws/cache/Cache@ object, which is value of Monitor field on the right hand size. Then under that thread is list of threads waiting to get lock on the cache object. The WebContainer 67 thread is waiting for the lock on that object and there are 218 threads waiting for Monitor that WebContainer 67 owns.
- Conclusion of this issue was that Non-deferrable thread is doing something to block all the web container threads. I looked at the stack trace for that thread on the right hand side to figure out it is doing some database operation. When i scrolled little down i could see my hibernate function that was making JDBC query. This JDBC query was taking really long to return results so i made changes to fix it and that solved my server hang issue


Application server or portal server hangs
It might happen that your application or portal server is hanging or getting terminated unexpectedly or other case is the server is taking really long time to respond. In these cases you might want to generate JavaDump to see what different threads are doing and then analyze the data to find the problem. Although a Javacore or javadump can occur in Solaris JVMs, much of the content of the Javacore is added by IBM and, so, is present only in IBM JVMs.
Important: If there is a steady increase in servlet engine threads in use, review application synchronized code blocks for possible deadlock conditions.
By triggering Java thread dump or javacore when a process does not respond,its possible to collect diagnostic information related to the JVM captured at particular point of execution.The code that creates a JavaCore or javadump is part of the JVM. By defautl a javacore occurs when the JVM terminates unexpectedly or it can be triggered by sending specific signal to the JVM.
We can generate thread dumps by first finding out the process id of your server from the .pid file in the logs folder for that server then you have two options
You can either execute kill -3 <processid>, this command would generate thread dump but wont terminate the JVM or you can execute the kill -11 <processid> command this will generate the thread dump and kill the java process. On the Windows platform, you can use keyboard combinations like Ctrl-Break to send signal 3 to a process running in a command line window. THe resultant javacore file would be close 1MB or little more than that in size depending on no. of threads that you have.
Other option for generating thread dump is by executing this wsadmin script. In this case i am generating dump of WebSphere_Portal server, thats why i am passing process=WebSphere_Portal. Use Server Name of the server that you want to generate thread dump for.
Once you execute this command you will see javacore.*.txt file in your profile directory. In case of WebSphere_Portal it will be in the wp_profile directory.
Once you have the JavaCore file you can either open it in text editor and try to understand it or you can use one of the tools that are available from the IBM support site to read and analyze this file for you.
A Java thread dump is the one of the traces/dumps that JVM provides to help diagnosis a hang, deadlock, or monitor contention issue. It contains diagnostic information related to the JVM and a Java application captured at a point during execution. For example, the information can be a list of all the threads that run on a Java virtual machine. Usually thread dumps have more than just thread information. Thread dumps can produce information about the operating system, application environment, threads, stacks, locks, and memory. IBM Thread Dumps/Javacores provide much more information like core interface, data conversion/unicode, class, diagnosis, execution management/thread management, lock, execution engine, mixed mode interpreter, JIT (Just-in-Time compiler), storage/JVM heap, and hardware portability interface/extended hardware portability interface.
The contents and formats of Java thread dumps depend on the platform you're running on and the JVM provider.
Since a thread dump's format isn't a part of the SDK specification, each SDK vendor provides a unique thread dump format and its own JVM information. Currently IBM Thread and Monitor Dump Analyzer for Java understands IBM, Solaris, and HP-UX Java thread dump formats.
You can download the IBM Thread and Monitor dump analyzer tool from IBM Alphaworks site and then open it by executing following command
The thread dump analyzer is also available as part of IBM Support Assistant. You can launch it from IBM support assistant by going to Launch Activity -> Analyze Problem then switching to Tools tab. On this tab select IBM Thread and Dump Analyzer for Java and click on launch to launch the tool

Once the tool is started on the first screen select File -> Open Thread Dumps and select the java core file that you just generated like this
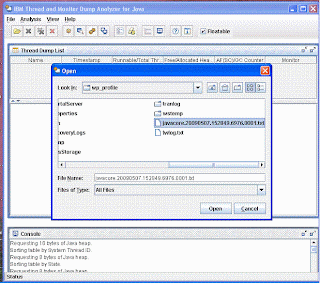
The Thread Dump analyzer will take few minutes to analyze the javacore and once it is done analyzing it will display name of the javacore when you select that name it will display details about the process in the pan below the name. You can right click and select Thread Details

It will take you to the next screen that will display what all threads are running and what is state of the threads. Check if you can see any deadlocks here or threads that are in blocked state waiting for some operation to complete

In my case there are no deadlocks but large no. of threads are blocked. So i will have to find out why threads are blocked. You can find information on how to use Thread dump analyzer in the help section.
Important: If there is a steady increase in servlet engine threads in use, review application synchronized code blocks for possible deadlock conditions.
Generating JavaDump manually
By triggering Java thread dump or javacore when a process does not respond,its possible to collect diagnostic information related to the JVM captured at particular point of execution.The code that creates a JavaCore or javadump is part of the JVM. By defautl a javacore occurs when the JVM terminates unexpectedly or it can be triggered by sending specific signal to the JVM.
We can generate thread dumps by first finding out the process id of your server from the .pid file in the logs folder for that server then you have two options
You can either execute kill -3 <processid>, this command would generate thread dump but wont terminate the JVM or you can execute the kill -11 <processid> command this will generate the thread dump and kill the java process. On the Windows platform, you can use keyboard combinations like Ctrl-Break to send signal 3 to a process running in a command line window. THe resultant javacore file would be close 1MB or little more than that in size depending on no. of threads that you have.
Other option for generating thread dump is by executing this wsadmin script. In this case i am generating dump of WebSphere_Portal server, thats why i am passing process=WebSphere_Portal. Use Server Name of the server that you want to generate thread dump for.
jvm=AdminControl.completeObjectName('type=JVM,process=WebSphere_Portal,*')
AdminControl.invoke(jvm,'dumpThreads')
Once you execute this command you will see javacore.*.txt file in your profile directory. In case of WebSphere_Portal it will be in the wp_profile directory.
Once you have the JavaCore file you can either open it in text editor and try to understand it or you can use one of the tools that are available from the IBM support site to read and analyze this file for you.
What Is a Thread Dump?
A Java thread dump is the one of the traces/dumps that JVM provides to help diagnosis a hang, deadlock, or monitor contention issue. It contains diagnostic information related to the JVM and a Java application captured at a point during execution. For example, the information can be a list of all the threads that run on a Java virtual machine. Usually thread dumps have more than just thread information. Thread dumps can produce information about the operating system, application environment, threads, stacks, locks, and memory. IBM Thread Dumps/Javacores provide much more information like core interface, data conversion/unicode, class, diagnosis, execution management/thread management, lock, execution engine, mixed mode interpreter, JIT (Just-in-Time compiler), storage/JVM heap, and hardware portability interface/extended hardware portability interface.
The contents and formats of Java thread dumps depend on the platform you're running on and the JVM provider.
Since a thread dump's format isn't a part of the SDK specification, each SDK vendor provides a unique thread dump format and its own JVM information. Currently IBM Thread and Monitor Dump Analyzer for Java understands IBM, Solaris, and HP-UX Java thread dump formats.
Thread dump analyzer
You can download the IBM Thread and Monitor dump analyzer tool from IBM Alphaworks site and then open it by executing following command
java -Xmx[heap size] -jar jca.jar_
The thread dump analyzer is also available as part of IBM Support Assistant. You can launch it from IBM support assistant by going to Launch Activity -> Analyze Problem then switching to Tools tab. On this tab select IBM Thread and Dump Analyzer for Java and click on launch to launch the tool

Once the tool is started on the first screen select File -> Open Thread Dumps and select the java core file that you just generated like this

The Thread Dump analyzer will take few minutes to analyze the javacore and once it is done analyzing it will display name of the javacore when you select that name it will display details about the process in the pan below the name. You can right click and select Thread Details

It will take you to the next screen that will display what all threads are running and what is state of the threads. Check if you can see any deadlocks here or threads that are in blocked state waiting for some operation to complete

In my case there are no deadlocks but large no. of threads are blocked. So i will have to find out why threads are blocked. You can find information on how to use Thread dump analyzer in the help section.
Subscribe to:
Posts (Atom)