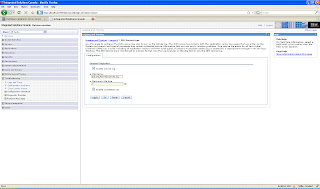
The WebSphere Application Server provides two tools that you can use to work with the service log
- Log Analyzer: This is GUI tool that is part of WebSphere Application Server toolkit
- showlog: This is command line tool that is shipped with WebSphere Application server
You can find the
showlog tool inside the WebSphere/AppServer/bin folder. If you execute it without arguments it will print out help for that tool

c:\WebSphere\AppServer\bin>showlog.bat
This program dumps a Websphere binary log file to standard out or a file.
Usage: showlog [-format CBE-XML-1.0.1] binaryFilename [outputFilename]
where:
        -format specifies the output format.  Currently only CBE-XML-1.0.1 forma
t is supported (this complies with the Common Base Event specification version 1
.0.1).  If no format is given, showlog outputs in a tabular format.

        binaryFilename should be a binary log filename in the WASHOME/logs direc
tory or a fully-qualified binary log filename.  showlog will not look in the cur
rent directory.

        outputFilename is optional.  If no filename is given, showlog dumps bina
ryFilename to standard out.  Otherwise, outputFilename will be created in the cu
rrent directory unless it is a fully-qualified filename.


You can execute the showlog tool by using this command

C:\WebSphere\AppServer\profiles\AppSrv01\bin>showlog.bat c:\WebSphere\
AppServer\profiles\AppSrv01\logs\activity.log c:\temp\activity.log


Wait for this command to finish execution then you can open the c:\temp\activity.log in text editor to look at the activity log. This is sample activity.log from my machine.


ExtendedMessage:
---------------------------------------------------------------
ComponentId:  Application Server
ProcessId:  5492
ThreadId:  00000025
ThreadName:  Non-deferrable Alarm : 5
SourceId:  com.ibm.ws.Transaction.JTA.FailureScopeController
ClassName:
MethodName:
Manufacturer:  IBM
Product:  WebSphere
Version:  Platform 6.1 [BASE 6.1.0.0 b0620.14]
ServerName:  sunpatil-wxp02Node01Cell\sunpatil-wxp02Node01\server1
TimeStamp:  2009-06-29 12:47:44.836000000
UnitOfWork:
Severity:  3
Category:  AUDIT
PrimaryMessage:  WTRN0105I: The transaction service has shutdown successfully with no transactions requiring recovery.
ExtendedMessage:
---------------------------------------------------------------
ComponentId:  Application Server
ProcessId:  5492
ThreadId:  00000025
ThreadName:  Non-deferrable Alarm : 5
SourceId:  com.ibm.ws.runtime.component.ServerCollaborator
ClassName:
MethodName:
Manufacturer:  IBM
Product:  WebSphere
Version:  Platform 6.1 [BASE 6.1.0.0 b0620.14]
ServerName:  sunpatil-wxp02Node01Cell\sunpatil-wxp02Node01\server1
TimeStamp:  2009-06-29 12:47:45.086000000
UnitOfWork:
Severity:  3
Category:  AUDIT
PrimaryMessage:  WSVR0024I: Server server1 stopped
ExtendedMessage:

796 records found and printed.
