Showing posts with label IBMSupportassistance. Show all posts

IBM Support Assistant - Collect Data

You can also use IBM Support Assistant tool for collecting data (Same Functionality as that of IBM Support Assistant Lite), though collecting data with ISA asks for same inputs as ISA Lite the look and feel of ISA Collector tool is much better

You can reach the Collect tool by clicking on Launch Activity -> Collect and Send Data, In my sample screen i am collecting General data.


This is the view that i get after data is collected


As you can see the collected data can be related to a case and uploaded from here.

IBM Support Assistant - Find Information

The IBM SUpport assistant provides Find Information functionality that you can use to find more information about the your product or the problem that your facing

Search Information


This view lets you search for particular keyword across different sources. Ex. I was working on this problem where WAS was throwing Http 409 error code. SO i can search for information on that error code in IBM Support site, Developer Works site, Google,..


Media Viewer


The Media Viewer tab lets you find the available media for that product such as WAS 6.1 Performance related information from Education Assistant, related .pdf flash files and red books


Product Information


The Product Information tab shows product related information such as recently recommended fixes, Flash, APARS,..

Using ISALite in GUI Mode

Use the following steps to use the ISALite in the GUI mode


  • Execute the runISALite.bat file and you will get a GUI tool like this


  • Now select the type of problem for which you want to collect the data. Lets assume that i am having a problem in Starting server so, i selected problem type as Start problem and i want to store the collected data on desktop in serverStartProblem.zip

    Now click on the Collect Data button to start the actual process for collecting the data

  • I got this warning message that ISA Lite Should be run on the DMGr machine. In my case its standalone environment so its ok.


  • Next it asked me for the root directory where WebSphere APplication server is installed.


  • After that it asked me for the name of the server


  • On the next screen i had to enter my WAS Admin user id and password like this


  • I had to answer few more questions about the server startup


  • Once the data collection process is started, it will run for few minutes and at the end it will ask you if you want to transfer the collected data to IBM Support site

    I did select Do Not Transfer data here.

  • When i opened the startServerProblem.zip file i could see that it collected lots of data related to the problem such as log files, ffdc folder, some important properties files...


    It also turned trace on for

    [7/14/09 8:22:48:920 PDT] 00000041 ManagerAdmin I TRAS0018I: The trace state has changed. The new trace state is *=info.
    [7/14/09 8:23:11:669 PDT] 00000041 ManagerAdmin I TRAS0018I: The trace state has changed. The new trace state is *=info:com.ibm.websphere.*=finest.

IBM SUpport Assistant Lite Quick Data Collection

The IBM Support Assistant Lite (Quick Data Collection), tool lets you collect all the necessary data that support might need to debug your problem.

You can download WebSphere Application Server specific version of ISA Lite from Download IBM Support Assistant (ISA) Lite for WebSphere Application Server page. After downloading the .zip file you can extract it in a directory and you will something like this.


You can use the ISALIte either in Console mode by executing runISALiteConsole.bat or run ISA Lite in the GUI mode by executing runISALite.bat.

IBM Support Assistant

The IBM Support assistant product comes in three flavors

  1. IBM Support assistant Lite: This product is just for collecting all the necessary data such as configuration, logs and traces, version and history information. When you open a support request with IBM they might ask you collect diagnostic data from your system using IBM Support assistance lite

  2. Serviceability Workbench: This product is also known as IBM Support assistant, its a Eclipse based product which can not only collect the necessary data but also has some trouble shooting tools such as Thread Dump Analyzer, Heap Dump Analyzer,..

  3. Enterprise Solution: Deploy the IBM Support Assistant Agent onto systems in your enterprise to enable remote problem determination. Use Agents to run remote data collections, take inventory of remote systems, filter and collect remote log files, and perform other remote problem determination tasks. The Agent component is optional and works in conjunction with the IBM Support Assistant Workbench.


You can download any of the three products from ISA Home Page

Manually generating heap dump

You can use the WSAdmin script to generate heapdump for the JVM. Use this Jython script to do that

def generateHeapDump(serverName):
serverJVM = AdminControl.queryNames("type=JVM,process="+serverName+",*")
print serverJVM
AdminControl.invoke(serverJVM,"generateHeapDump")


generateHeapDump("server1")


Just call the generateHeapDump() function with name of the server that you want to generate heap dump for.

Once this script is executed open the native_stderr.log file to find out the location of heap dump file. In my case i see these lines in the native_stderr.log file

JVMDUMP007I JVM Requesting Heap Dump using 'C:\Cert\WebSphere\AppServer\profiles\AppSrv01\heapdump.20090705.140924.8660.0001.phd'
JVMDUMP010I Heap Dump written to C:\Cert\WebSphere\AppServer\profiles\AppSrv01\heapdump.20090705.140924.8660.0001.phd


You can open the file name ending with .phd in the HeapAnalyzer tool

IBM HeapAnalyzer

If you get OutOfMemory exception or your server is performing slow and the JVM Memory utilization is going up continously then you might want to take a look at JVM Memory Heap. THis is two step process first you should generate heap dump on your server and then analyze what all objects are there on the heap and if there is a memory leak

The IBM HeapAnalyzer tool lets you analyze the heap dump generated by WebSphere Application Server. This tool is shipped with IBM Support Assistant or you can download it from the Alpha works site. I tried using the HeapAnalyzer that is part of the ISA 4.1 but it kept crashing so i had to download it from Alpha Works Site

I wanted to learn how to use Heap Analyzer Tool to identify Memory Leaks, so i started by creating a MemoryLeakServlet and then i used the JMeter tool to generate load on this server. The load test ran for few minutes and then WAS started throwing OutOfMemory exception. Please note that when the WAS server throws OutOfMemory exception it generates Heap Dump.

Since i am using standalone version of Heap ANalyzer i had to start using the command line like this


The HeapANalyzer tool is very memory intensive so you should not run it on production and run it on a machine which has lot of memory.

Once the tool is opend select the .hpd file by clicking on Open and then selecting the heap dump file like this


The tool will take few minutes to analyze the heap data and then it will generate view like this.


As you can see the Reference Tree section is showing the objects on the heap in tree format. Now if you click on Subponea Leak Suspect button you will see that there is one suspected memory leak so select the button and it will take you the object which is suspected to have the memory leak.


As you can see it is showing the ArrayList object which is inside MemoryLeakServlet as memory leak.

IBM Pattern modeling and Analysis tool for Java

The IBM Pattern modeling and Analysis tool(PMAT) for Java lets analyze the data from garbage collection and in case of problems such as heap exhaustion (In case of OutOfMemory error) it also gives you recommendations. Please note one important point that the GC analysis tool alone cant help you locate the memory leak and fix it. You will have to use IBM Heap analyzer for that.

The PMAT tool is part of IBM Support Assistant 4.1, you can launch it by going to Launch Activities -< Analyze Problems. Then in the Tools Catalog select the IBM Pattern Modeling and Analysis tool and click on launch


It will ask you for the location of native_stderr.log file for your server. Select the file and click on Ok


Once opened it will show you the summary of gc analysis like this


  • File name : Location and file name of verbosegc trace

  • Number of verboseGC cycles : Number of JVM restart

  • Number of Garbage Collections : GC frequency

  • Number of Allocation failures : AF frequency

  • First Garbage Collection : Timestamp of the first GC

  • Last Garbage Collection : Timestamp of the last GC

  • Number of Java heap exhaustion : Number of OutOfMemoryError

  • Maximum AF overhead : Ratio of time spent in AF and time between AFs

  • Number of 100% overhead : Number of AF overhead 100%

  • Maximum size of Large Object Request : The largest object request and timestamp

  • Number of Large Object Requests : Number of object request (>900KB)

  • List of Java heap failure : Timestamp, Requested Java heap size,Type of failure and available Java heap size.


During the first few minutes of executing memory leak servlet. It did not throw OutOfMemory exception so in the recommendation it says that no memory exhaustion but there seems to be increase in java heap size, this can be taken as early warning sign of memory leak in the application.

After few minutes when the memory was exhausted and was started throwing OutOfMemory exception i looked at the gc analysis again in the PMAT tool and this is what i see


As you can see there are three errors related to java heap exhaustion that means the GC not able to free up memory and heap is full. One other thing is that whenever there is OutOfMemory error was would generate heap dump automatically. You can get location of the heapdump file from native_stderr.log file.


You can also look at the graphical memory analysis of the data by right clicking on the File and clicking Graphical view all


It will show you the graph of memory like this


As you can see the memory usage went really up some time after 12:33:35 and the red line shows the memory used and blue line show the heap freed after gc. As you can see red line is at near about 100 % and blue line at 0% that means memory is used and gc cant free up space.The vertical black dotted line where blue and red line terminate shows server restart.

Memory Leak Servlet

I wanted to learn how to identify the Memory Leaks in WAS and how to analyze the problem using
1) The IBM Pattern modeling and Analysis tool for Java
2) IBM HeapAnalyzer tool

So i started by creating a sample MemoryLeakServlet like this.

public class MemoryLeakServlet extends HttpServlet {
private static final long serialVersionUID = 1L;
private static ArrayList st = new ArrayList();

protected void doGet(HttpServletRequest request, HttpServletResponse response) throws ServletException, IOException {
ArrayList st1 = new ArrayList();
st1.add("This is a big string This is a big string This is a big string This is a big string This is a big string This is a big string This is a big string This is a big string This is a big string This is a big string This is a big string This is a big string ");
System.out.println("Inside MemoryLeakServlet.doGet() " + st.size());

st.add(st1);
response.setContentType("text/html");
response.getWriter().println("Hello from memory leak servlet");
}

}


As you can see the MemoryLeakServlet has one static ArrayList st and i keep adding data to it for every HTTP GET request.

Once that was done i used JMEter to create a simple performance test which kept making HTTP GET requests to MemoryLeakServlet until i got OutOfMemory leak error and during that time i kept looking at native_stderr.log file using PAM tool to see what type of data i see

Verbose garbage collection

When you turn the verbose garbage collection on, WAS will start printing garbage collection related information in your native_stderr.log file. You can turn the vebose garbage collection on using WAS Admin Console by going to Application servers < servername servers < Process Definition servers < Java Virtual Machine


On this screen check verbose garbage collection checkbox and restart the server for your changes to take effect. Once you enable the verbose garbage collection on the WAS server will start writing messages into native_stderr.log file every time it executes garbage collection.

These are couple of entries from my native_stderr.log file.


<af type="tenured" id="49" timestamp="Jul 05 13:13:17 2009" intervalms="32.872">
<minimum requested_bytes="16776" />
<time exclusiveaccessms="0.044" />
<tenured freebytes="3624584" totalbytes="116873216" percent="3" >
<soa freebytes="3624584" totalbytes="116873216" percent="3" />
<loa freebytes="0" totalbytes="0" percent="0" />
</tenured>
<gc type="global" id="49" totalid="49" intervalms="34.359">
<refs_cleared soft="0" threshold="32" weak="0" phantom="0" />
<finalization objectsqueued="0" />
<timesms mark="107.399" sweep="1.583" compact="0.000" total="109.117" />
<tenured freebytes="43894704" totalbytes="116873216" percent="37" >
<soa freebytes="43894704" totalbytes="116873216" percent="37" />
<loa freebytes="0" totalbytes="0" percent="0" />
</tenured>
</gc>
<tenured freebytes="43877928" totalbytes="116873216" percent="37" >
<soa freebytes="43877928" totalbytes="116873216" percent="37" />
<loa freebytes="0" totalbytes="0" percent="0" />
</tenured>
<time totalms="110.648" />
</af>

<af type="tenured" id="50" timestamp="Jul 05 13:13:18 2009" intervalms="232.708">
<minimum requested_bytes="32" />
<time exclusiveaccessms="0.031" />
<tenured freebytes="0" totalbytes="116873216" percent="0" >
<soa freebytes="0" totalbytes="116873216" percent="0" />
<loa freebytes="0" totalbytes="0" percent="0" />
</tenured>
<gc type="global" id="50" totalid="50" intervalms="234.140">
<classloadersunloaded count="13" timetakenms="48.694" />
<expansion type="tenured" amount="19868672" newsize="136741888" timetaken="0.152" reason="excessive time being spent in gc" gctimepercent="49" />
<refs_cleared soft="0" threshold="32" weak="3" phantom="0" />
<finalization objectsqueued="0" />
<timesms mark="118.982" sweep="2.639" compact="0.000" total="170.899" />
<tenured freebytes="55392816" totalbytes="136741888" percent="40" >
<soa freebytes="55392816" totalbytes="136741888" percent="40" />
<loa freebytes="0" totalbytes="0" percent="0" />
</tenured>
</gc>
<tenured freebytes="55392176" totalbytes="136741888" percent="40" >
<soa freebytes="55392176" totalbytes="136741888" percent="40" />
<loa freebytes="0" totalbytes="0" percent="0" />
</tenured>
<time totalms="172.525" />
</af>


The way IBM JDK works is if it is not able to allocate a memory then it will execute garbage collection to free up the memory. The J9 VM used in WAS 6.1 generates one <af> element every time a garbage collection works.

The af element has following elements

  • type:

  • id: The id represents how many times the gc was executed

  • intervalms: The time in ms since last time gc was executed

  • timestamp: time of gc


The minimum represents the number of bytes that were requested and JVM couldnot allocate them so it had to trigger garbage collection cycle.

The af element has 3 main child elements first tenured element has data about the tenured memory position before gc then gc element represents data about what happened during gc, such as time spent in mark, sweep and compact phases, The second tenured element represents the position of tenured memory after gc.


The IBM Support assistance has IBM Pattern modeling and Analysis tool for Java Garbage collection tool that can be used to analyze the garbage collection.

Debugging Connection leaks

One of the common problems that we uncover during performance testing is JDBC Connection leak. When a J2EE project is using normal JDBC code instead of OR-Mapping framework such Hibernate or Spring there is a good chance that they run into issues that connection was opened but not closed so there is a connection leak.

The code works fine in development environment but in performance environment after some time you start seeing this error Timed Out waiting for connection. This shows problem that some part of your business logic is trying to open a database connection but it is not able to get it.

[7/2/09 9:53:21:411 PDT] 00000085 AdapterUtil > toSQLException Entry
com.ibm.websphere.ce.j2c.ConnectionWaitTimeoutException: Connection not available, Timed out waiting for 180004
at com.ibm.ejs.j2c.FreePool.createOrWaitForConnection(FreePool.java:1470)
at com.ibm.ejs.j2c.PoolManager.reserve(PoolManager.java:2141)
at com.ibm.ejs.j2c.ConnectionManager.allocateMCWrapper(ConnectionManager.java:843)
at com.ibm.ejs.j2c.ConnectionManager.allocateConnection(ConnectionManager.java:582)
at com.ibm.ws.rsadapter.jdbc.WSJdbcDataSource.getConnection(WSJdbcDataSource.java:431)
at com.ibm.ws.rsadapter.jdbc.WSJdbcDataSource.getConnection(WSJdbcDataSource.java:400)
at com.wpcertification.jdbc.ConnectionLeakServlet.doGet(ConnectionLeakServlet.java:41)
at javax.servlet.http.HttpServlet.service(HttpServlet.java:743)
at javax.servlet.http.HttpServlet.service(HttpServlet.java:856)
at com.ibm.ws.webcontainer.servlet.ServletWrapper.service(ServletWrapper.java:966)
at com.ibm.ws.webcontainer.servlet.ServletWrapper.handleRequest(ServletWrapper.java:478)
at com.ibm.ws.wswebcontainer.servlet.ServletWrapper.handleRequest(ServletWrapper.java:463)
at com.ibm.ws.webcontainer.webapp.WebApp.handleRequest(WebApp.java:3107)
at com.ibm.ws.webcontainer.webapp.WebGroup.handleRequest(WebGroup.java:238)
at com.ibm.ws.webcontainer.WebContainer.handleRequest(WebContainer.java:811)
at com.ibm.ws.wswebcontainer.WebContainer.handleRequest(WebContainer.java:1425)
at com.ibm.ws.webcontainer.channel.WCChannelLink.ready(WCChannelLink.java:92)
at com.ibm.ws.http.channel.inbound.impl.HttpInboundLink.handleDiscrimination(HttpInboundLink.java:465)
at com.ibm.ws.http.channel.inbound.impl.HttpInboundLink.handleNewInformation(HttpInboundLink.java:394)
at com.ibm.ws.http.channel.inbound.impl.HttpInboundLink.ready(HttpInboundLink.java:274)
at com.ibm.ws.tcp.channel.impl.NewConnectionInitialReadCallback.sendToDiscriminators(NewConnectionInitialReadCallback.java:214)
at com.ibm.ws.tcp.channel.impl.NewConnectionInitialReadCallback.complete(NewConnectionInitialReadCallback.java:113)
at com.ibm.ws.tcp.channel.impl.AioReadCompletionListener.futureCompleted(AioReadCompletionListener.java:152)
at com.ibm.io.async.AbstractAsyncFuture.invokeCallback(AbstractAsyncFuture.java:213)
at com.ibm.io.async.AbstractAsyncFuture.fireCompletionActions(AbstractAsyncFuture.java:195)
at com.ibm.io.async.AsyncFuture.completed(AsyncFuture.java:136)
at com.ibm.io.async.ResultHandler.complete(ResultHandler.java:193)
at com.ibm.io.async.ResultHandler.runEventProcessingLoop(ResultHandler.java:725)
at com.ibm.io.async.ResultHandler$2.run(ResultHandler.java:847)
at com.ibm.ws.util.ThreadPool$Worker.run(ThreadPool.java:1498)


The IBM Support Assistant tool provides "Database connection pool analyzer" that you can use to debug the connection pool problems. Follow these steps to work with the tool.

  • First enable the JDBC Connection pool related trace by enabling trace for the following trace string

    WAS.database=finest:WAS.j2c=finest:RRA=finest


  • Run your load test case and let it generate the com.ibm.websphere.ce.j2c.ConnectionWaitTimeoutException: error.

  • Start the IBM Support assistant and then go to Launch Activity -< Analyzer Problem -< Tools.

  • Select the Database Connection Pool Analyzer for IBM WebSPhere Application Server and click on launch button. It will ask you for name of the trace file, so select the trace file from your app server that has Connection pool related trace.


  • It will open the tool with information on all the data sources in your application server and show how each of them is doing, things like no. of connections used,...

  • In my environment i have only one data source /jdbc/sampleDB, select it and it will show usage graph for that connection along with the MVC wrapper information.

  • Now select one of the Never Released messages and it will display the stack trace of the connection was never released. Did you notice that it is displaying the stack of calls that were made to get that connection. Now i know that the connection that i am getting in com.wpcertification.jdbc.ConnectionLeakServlet.doGet(ConnectionLeakServlet.java:41) is never released, so i can make changes to fix that code.


Using Thread dump analyzer to detect server hang/ Server Crash

Recently i was debugging one server crash problem during performance testing. So what was happening is the code was running ok during manual testing but once we started performance testing and have 200 users hitting portal every minute after 30 minutes of so server was getting hanged and stopped responding. When i looked at the SystemOut i could see the WebContainer thread hanged message (I think WebSphere VE is generating that alert).

So when the server was hanged we took javacore dump on portal node using kill -3 <serverprocessid>. Then i took the javacore.*.txt file and analyzed it using the Thread Dump analyzer following these steps.


  • Start the thread dump analyzer and open the javacore.*.txt file. Thread dump analyzer will take couple of minutes then display this UI.


  • As you can see the Monitor column is showing 3 open monitors. Monitor is used when your saying using synchronized block or function any where. If you have say static synchronized method then only one thread can enter in it and others would wait to get monitor for that thread

  • Right click on the javacore file and click on Thread details. The next screen will show details of all the threads running. YOu can see that there are no threads in the deadlock but 255 threads are blocked. That means 255 threads are waiting for something.


  • Now you can go back to the main screen and right click on the javacore and say Monitor detail. It will open a tree view like this


  • This view displays which thread is currently running and has monitor and who all is waiting for that monitor. In my case Non-deferrable alarm: 3 thread is running and it owns lock on com/ibm/ws/cache/Cache@ object, which is value of Monitor field on the right hand size. Then under that thread is list of threads waiting to get lock on the cache object. The WebContainer 67 thread is waiting for the lock on that object and there are 218 threads waiting for Monitor that WebContainer 67 owns.

  • Conclusion of this issue was that Non-deferrable thread is doing something to block all the web container threads. I looked at the stack trace for that thread on the right hand side to figure out it is doing some database operation. When i scrolled little down i could see my hibernate function that was making JDBC query. This JDBC query was taking really long to return results so i made changes to fix it and that solved my server hang issue

Application server or portal server hangs

It might happen that your application or portal server is hanging or getting terminated unexpectedly or other case is the server is taking really long time to respond. In these cases you might want to generate JavaDump to see what different threads are doing and then analyze the data to find the problem. Although a Javacore or javadump can occur in Solaris JVMs, much of the content of the Javacore is added by IBM and, so, is present only in IBM JVMs.

Important: If there is a steady increase in servlet engine threads in use, review application synchronized code blocks for possible deadlock conditions.

Generating JavaDump manually


By triggering Java thread dump or javacore when a process does not respond,its possible to collect diagnostic information related to the JVM captured at particular point of execution.The code that creates a JavaCore or javadump is part of the JVM. By defautl a javacore occurs when the JVM terminates unexpectedly or it can be triggered by sending specific signal to the JVM.

We can generate thread dumps by first finding out the process id of your server from the .pid file in the logs folder for that server then you have two options
You can either execute kill -3 <processid>, this command would generate thread dump but wont terminate the JVM or you can execute the kill -11 <processid> command this will generate the thread dump and kill the java process. On the Windows platform, you can use keyboard combinations like Ctrl-Break to send signal 3 to a process running in a command line window. THe resultant javacore file would be close 1MB or little more than that in size depending on no. of threads that you have.

Other option for generating thread dump is by executing this wsadmin script. In this case i am generating dump of WebSphere_Portal server, thats why i am passing process=WebSphere_Portal. Use Server Name of the server that you want to generate thread dump for.

jvm=AdminControl.completeObjectName('type=JVM,process=WebSphere_Portal,*')
AdminControl.invoke(jvm,'dumpThreads')


Once you execute this command you will see javacore.*.txt file in your profile directory. In case of WebSphere_Portal it will be in the wp_profile directory.

Once you have the JavaCore file you can either open it in text editor and try to understand it or you can use one of the tools that are available from the IBM support site to read and analyze this file for you.

What Is a Thread Dump?


A Java thread dump is the one of the traces/dumps that JVM provides to help diagnosis a hang, deadlock, or monitor contention issue. It contains diagnostic information related to the JVM and a Java application captured at a point during execution. For example, the information can be a list of all the threads that run on a Java virtual machine. Usually thread dumps have more than just thread information. Thread dumps can produce information about the operating system, application environment, threads, stacks, locks, and memory. IBM Thread Dumps/Javacores provide much more information like core interface, data conversion/unicode, class, diagnosis, execution management/thread management, lock, execution engine, mixed mode interpreter, JIT (Just-in-Time compiler), storage/JVM heap, and hardware portability interface/extended hardware portability interface.
The contents and formats of Java thread dumps depend on the platform you're running on and the JVM provider.
Since a thread dump's format isn't a part of the SDK specification, each SDK vendor provides a unique thread dump format and its own JVM information. Currently IBM Thread and Monitor Dump Analyzer for Java understands IBM, Solaris, and HP-UX Java thread dump formats.

Thread dump analyzer


You can download the IBM Thread and Monitor dump analyzer tool from IBM Alphaworks site and then open it by executing following command


java -Xmx[heap size] -jar jca.jar_


The thread dump analyzer is also available as part of IBM Support Assistant. You can launch it from IBM support assistant by going to Launch Activity -> Analyze Problem then switching to Tools tab. On this tab select IBM Thread and Dump Analyzer for Java and click on launch to launch the tool


Once the tool is started on the first screen select File -> Open Thread Dumps and select the java core file that you just generated like this
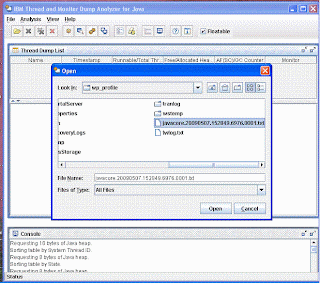


The Thread Dump analyzer will take few minutes to analyze the javacore and once it is done analyzing it will display name of the javacore when you select that name it will display details about the process in the pan below the name. You can right click and select Thread Details


It will take you to the next screen that will display what all threads are running and what is state of the threads. Check if you can see any deadlocks here or threads that are in blocked state waiting for some operation to complete


In my case there are no deadlocks but large no. of threads are blocked. So i will have to find out why threads are blocked. You can find information on how to use Thread dump analyzer in the help section.

Searching information using IBM Support Assistance

Today i was trying to find out more information on "EJPWC1100E: Policy has denied access" the exception that i was getting while configuring WSRP and i learned about how to use IBM Support Assistance to get help on the error.

After starting the IBM SUpport assistance click on Find Information on the Home Page. Then enter the problem that your facing in the Search field and click go. The IBM Support Assistance will try to find out information that resource in
1) IBM support website
2) IBM news groups and forums
3) Google

When i tried to find information this is what i got. As you can see it found out one support document related to this issue and 6 google results.

How to use IBM Support Assistance Lite for WebSphere Portal

After downloading the IBM Support Assistance Lite for WebSphere Portal, i did extract the .zip file in wp_profile\PortalServer folder. THen go to wp_profile\PortalServer\ISALite and execute runISALite.bat to start the ISALite.

After opening ISALite you can select the problem that you want to collect trace for. I tried collecting trace for XMLAccess and decided to save the .zip file on the desktop like this


NOw click on Collect Data button. It will start collecting the trace. At this point it ask me few more questions about what is the Root directory of WAS, Portal, Login information for portal, the xmlaccess script that is failing,.. etc. At this point its started collecting trace but my machine hanged for some reason but when i rebooted my machine, i could see the xmlaccess.zip being created on my desktop that has all trace files for my server.

IBM Support Assistance Lite for WebSphere Portal

The IBM Support Assistant Lite for WebSphere Portal tool (formerly known as the IBM WebSphere Portal Automated Problem Determination tool) is provided as an aid for troubleshooting WebSphere Portal. The tool focuses on automatic data collection and provides symptom analysis support for WebSphere Portal Problem Determination Scenarios. Information pertinent to a problem scenario is collected and analyzed to help identify the origin of the problem being encountered

You can download it from IBM Support Assistant Lite for WebSphere Portal Tool

IBM Self Help Central for WebSphere Portal has more information for administrators

IBM Support Assistance

IBM Support assistance is a Utility that helps you diagnose and solve problems related to IBM products without contacting support. THe IBM SUpport assistance itself is built using Eclipse platform and is qutie generic but you can download and install product specific plugins in it.

You can install IBM Support assistance from the installation media for WebSphere Portal or you can download it from IBM Support Site

IBM Support assistance provides following functionality

  • To collect the diagnostic data that you need to open PMR with IBM

  • Open PMR with IBM, it provides customized on-line interface that also allows you to attach data to the PMR

  • To search through IBM and non-IBM knowledge and information sources across multiple IBM products to answer a question or solve a problem

  • To extend your ability to diagnose product-specific problems with targeted diagnostic tools available via the Support Assistant

  • To search through IBM and non-IBM knowledge and information sources across multiple IBM products to answer a question or solve a problem