Important: If there is a steady increase in servlet engine threads in use, review application synchronized code blocks for possible deadlock conditions.
Generating JavaDump manually
By triggering Java thread dump or javacore when a process does not respond,its possible to collect diagnostic information related to the JVM captured at particular point of execution.The code that creates a JavaCore or javadump is part of the JVM. By defautl a javacore occurs when the JVM terminates unexpectedly or it can be triggered by sending specific signal to the JVM.
We can generate thread dumps by first finding out the process id of your server from the .pid file in the logs folder for that server then you have two options
You can either execute kill -3 <processid>, this command would generate thread dump but wont terminate the JVM or you can execute the kill -11 <processid> command this will generate the thread dump and kill the java process. On the Windows platform, you can use keyboard combinations like Ctrl-Break to send signal 3 to a process running in a command line window. THe resultant javacore file would be close 1MB or little more than that in size depending on no. of threads that you have.
Other option for generating thread dump is by executing this wsadmin script. In this case i am generating dump of WebSphere_Portal server, thats why i am passing process=WebSphere_Portal. Use Server Name of the server that you want to generate thread dump for.
jvm=AdminControl.completeObjectName('type=JVM,process=WebSphere_Portal,*')
AdminControl.invoke(jvm,'dumpThreads')
Once you execute this command you will see javacore.*.txt file in your profile directory. In case of WebSphere_Portal it will be in the wp_profile directory.
Once you have the JavaCore file you can either open it in text editor and try to understand it or you can use one of the tools that are available from the IBM support site to read and analyze this file for you.
What Is a Thread Dump?
A Java thread dump is the one of the traces/dumps that JVM provides to help diagnosis a hang, deadlock, or monitor contention issue. It contains diagnostic information related to the JVM and a Java application captured at a point during execution. For example, the information can be a list of all the threads that run on a Java virtual machine. Usually thread dumps have more than just thread information. Thread dumps can produce information about the operating system, application environment, threads, stacks, locks, and memory. IBM Thread Dumps/Javacores provide much more information like core interface, data conversion/unicode, class, diagnosis, execution management/thread management, lock, execution engine, mixed mode interpreter, JIT (Just-in-Time compiler), storage/JVM heap, and hardware portability interface/extended hardware portability interface.
The contents and formats of Java thread dumps depend on the platform you're running on and the JVM provider.
Since a thread dump's format isn't a part of the SDK specification, each SDK vendor provides a unique thread dump format and its own JVM information. Currently IBM Thread and Monitor Dump Analyzer for Java understands IBM, Solaris, and HP-UX Java thread dump formats.
Thread dump analyzer
You can download the IBM Thread and Monitor dump analyzer tool from IBM Alphaworks site and then open it by executing following command
java -Xmx[heap size] -jar jca.jar_
The thread dump analyzer is also available as part of IBM Support Assistant. You can launch it from IBM support assistant by going to Launch Activity -> Analyze Problem then switching to Tools tab. On this tab select IBM Thread and Dump Analyzer for Java and click on launch to launch the tool

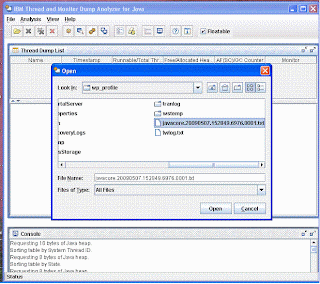
Once the tool is started on the first screen select File -> Open Thread Dumps and select the java core file that you just generated like this

The Thread Dump analyzer will take few minutes to analyze the javacore and once it is done analyzing it will display name of the javacore when you select that name it will display details about the process in the pan below the name. You can right click and select Thread Details

It will take you to the next screen that will display what all threads are running and what is state of the threads. Check if you can see any deadlocks here or threads that are in blocked state waiting for some operation to complete

In my case there are no deadlocks but large no. of threads are blocked. So i will have to find out why threads are blocked. You can find information on how to use Thread dump analyzer in the help section.
2 comments:
It is wonderful...But i am unable to see the pictures,especially in Application server performance and tuning section.
My mail id :t.c.kanth@gmail.com
Please send me the audio/video meterial if you have regarding Application server and Portal server.Will you take online classes on this..Please let me know
An good Post...
Appreciate the good work
Thanks
satya
Post a Comment