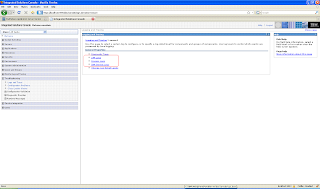
WebSphere APplication server generates logs of three types. You can configure them using WAS Admin Console by going to Troubleshooting -> Logging and Tracing -> <servername>

- JVM Logs:The JVM logs are created by redirecting the System.out and System.err streams of the JVM to independent log files. The System.out log is used to monitor the health of the running application server. The System.err log contains exception stack trace information that is used to perform problem analysis. One set of JVM logs exists for each application server and all of its applications. JVM logs are also created for the deployment manager and each node manager
- Process Logs: The process logs are created by redirecting the standard out and standard error streams of a process to independent log files. Native code writes to the process logs. These logs can also contain information that relates to problems in native code or diagnostic information written by the JVM. One set of process logs is created for each application server and all of its applications. Process logs are also created for the deployment manager and each node manager.
- IBM Service Logs:The IBM service log contains both the application server messages that are written to the System.out stream and special messages that contain extended service information that you can use to analyze problems. One service log exists for all Java virtual machines (JVMs) on a node, including all application servers and their node agent, if present. A separate activity log is created for a deployment manager in its own logs directory. The IBM Service log is maintained in a binary format. Use the Log Analyzer or Showlog tool to view the IBM service log.

1 comment:
Nice blog, really useful information. We are the leading email marketing company in mumbai. Hire our email marketing agency in mumbai today for best email marketing services in mumbai.
Post a Comment