In order to use the Tivoli Performance Viewer Advisor you will have to make sure that necessary PMI data collection is turned on. I wanted to try how it works so i used the HelloWorldServlet and generated some load using Apache JMEter.
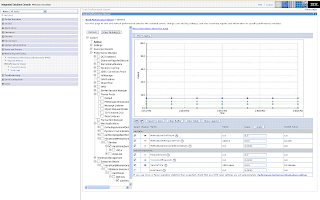
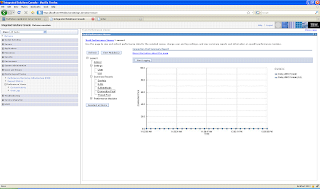
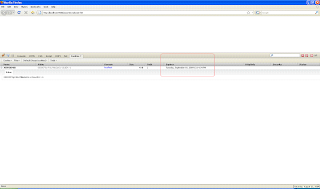
Then i went to TPV and inside that i clicked on the advisor, i saw this advice being generated
Click on the first link and it shows the advice in detail
Configuring Performance and diagnostic advisor
You can configure the Performance and Diagnostic advisor (PADA) either through the WAS Admin Console or using the wsadmin tool.
The PADA framework makes use of PMI data so before you start using the tool or make any configuration changes make sure that PMI is enable with suitable collection
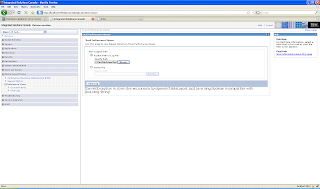
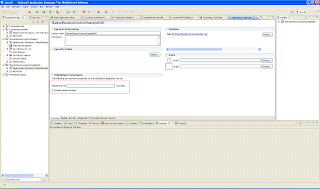
You can enable it using WAS Admin console by following these steps. In the WAS Admin Console, go to Servers -> Application Servers -> Server Name. Select the server for which you want to enable the advice and go to its detail page. On the server detail page click on Performance And Diagnostic Advisor Configuration link
Then you have to two options either you can enable Performance and Diagnostic provider, either you can enable it on Configuration tab, which requires server restart to take effect or you can make the changes on the Runtime tab.
After configuring PADA, i wanted to test is so i created a Apache JMeter test that will send request to HelloWorldServlet, which has a doGet() method like this
As you can see in the doGet() method i am getting HTTPSession object and then storing a file content into the httpSession as session attribute. I used JMeter to generate quite few hits to the HelloWorldServlet and then i started getting the performance advice in the SystemOut.log file like this
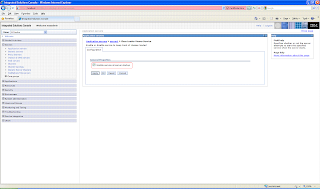
You can also look at these tuning advice using WAS Admin Console by going to Troubleshooting -> Runtime Messages -> Runtime Warnings like this
Important: To achieve the best results for performance tuning, start the Performance and Diagnostic Advisor when a stable production level load is running.
The PADA framework makes use of PMI data so before you start using the tool or make any configuration changes make sure that PMI is enable with suitable collection
You can enable it using WAS Admin console by following these steps. In the WAS Admin Console, go to Servers -> Application Servers -> Server Name. Select the server for which you want to enable the advice and go to its detail page. On the server detail page click on Performance And Diagnostic Advisor Configuration link
Then you have to two options either you can enable Performance and Diagnostic provider, either you can enable it on Configuration tab, which requires server restart to take effect or you can make the changes on the Runtime tab.
After configuring PADA, i wanted to test is so i created a Apache JMeter test that will send request to HelloWorldServlet, which has a doGet() method like this
protected void doGet(HttpServletRequest request, HttpServletResponse response) throws ServletException, IOException {
System.out.println("Inside HelloWorldServlet.doGet()");
HttpSession httpSession = request.getSession();
System.out.println("File Name " + request.getParameter("fileName"));
httpSession.setAttribute("testFile", getFileContent(request.getParameter("fileName")));
getServletContext().getRequestDispatcher("/index.jsp").include(request , response);
}
As you can see in the doGet() method i am getting HTTPSession object and then storing a file content into the httpSession as session attribute. I used JMeter to generate quite few hits to the HelloWorldServlet and then i started getting the performance advice in the SystemOut.log file like this
[8/31/09 22:34:33:268 PDT] 0000000f TraceResponse W TUNE0214W: The session cache for HelloWorld#HelloWorldWeb.war is smaller than the average number of live sessions. Increasing the session cache size to at least 4900.0 may improve performance.
Additional explanatory data follows.
Session cache size (the maximum in memory session count): 1,000.
Current live sessions: 4,900.
Average live sessions over the last sampling interval: 4,900.
This alert has been issued 1 time(s) in a row. The threshold will be updated to reduce the overhead of the analysis.
You can also look at these tuning advice using WAS Admin Console by going to Troubleshooting -> Runtime Messages -> Runtime Warnings like this
Important: To achieve the best results for performance tuning, start the Performance and Diagnostic Advisor when a stable production level load is running.
Types of performance advisor
Two types of performance advisors are available
- Performance and Diagnostic advisor: Runs within the JVM of application server. It writes the information warnings in SystemOut.log file as well as provides JMX notifications
You can configure the Performance and Diagnostic advisor using either WAS Admin console or wsadmin tool. Running in the JVM of the application server, the PADA checks for inefficient settings and issues recommendations as standard product warnings messages.These recommendations are displayed both as warnings in the administrative console under Runtime Messages in the WebSphere Application Server Status panel and as text in the application server SystemOut.log file. Enabling the Performance and Diagnostic Advisor has minimal system performance impact. The advice that the Performance and Diagnostic Advisor gives is all on the server level
You can also use the Performance and Diagnostic Advisor to enable the lightweight memory leak detection, which is designed to provide early detection of memory problems in test and production environments. - Performance advisor in Tivoli performance viewer: In stanad alone environment runs in the JVM of application server, in the ND environment runs in the JVM of node agent. Requries that you enable performance modules, counter or both on. You can look at the warning messages generated using the TPV in WAS admin console
The performance advisor in Tivoli Performance Viewer (TPV) provides advice to help tune systems for optimal performance and provide recommendations on inefficient settings by using collected Performance Monitoring Infrastructure (PMI) data. Obtain the advice by selecting the performance advisor in TPV.
What is performance advisior
The advisors analyze the Performance Monitoring Infrastructure (PMI) data of WebSphere Application Server using general performance principles, best practices, and WebSphere Application Server-specific rules for tuning. The advisors that are based on this information provide advice on how to set some of your configuration parameters to better tune WebSphere Application Server.
The advisors provide a variety of advice on the following application server resources:
- Object Request Broker service thread pools
- Web container thread pools
- Connection pool size
- Persisted session size and time
- Data source statement cache size
- Session cache size
- Dynamic cache size
- Java virtual machine heap size
- DB2 Performance Configuration wizard
Logging performance data with TPV
The Tivoli Performance Viewer (TPV) provides an easy way to store real-time data for system resources, WebSphere Application Server pools and queues, and applications in log files for later retrieval. You can start and stop logging while viewing current activity for a server, and later replay this data. Logging of performance data captures performance data in windows of time so you can later analyze the data.
Lets say during your performance testing you realized that something happens after the load reaches 100 users and the server hangs in next 5 min. Now when your running the test its difficult to look at all the statics or re-run the test several times. So what you can do is log the performance data at the time of running the test and then you can look at the data some later point of time.
Before you start logging data go to the log related settings page to make sure that it has correct settings
After that i went to the current activity screen and started logging of PMI data by clicking on start logging button
Now start executing your performance test, in my case i did manually hit the HelloWorldServlet few times and then i clicked on stop logging button
Once you stop logging you will notice that there is a .zip file that got created in the profiles_home\logs\tpv folder that file has tpv performance data, so you can view that data using was admin console like this
When you click on view data, it will take you the TPV and start displaying the logged data, you will have option play, rewind stop from here
Viewing PMI data with TPV
You can use the Tivoli Performance Viewer (TPV) to view Performance Monitoring Infrastructure (PMI) data in chart or table form. TPV monitors the performance activity of all servers on a node. This article assumes that one or more servers have been created and are running on the node, and that PMI is enabled.
You can debug performance problem by deciding what all performance data you want to look at. Ex. i wanted to see performance of sayHello() method in my HelloWorldEJB and how it relates to performance of HelloWorldServlet. So i selected HelloWorldServlet and sayHello() method of HelloWorldServlet under performance modules and it displayed data about how many times these method were called there response time, how the data relates to each other on time axis,...
In addition to these simple statics you can use TPV to look at all types of data such as how was your data source pool was doing in relation to the spike in Web container thread pool size....
TPV Summary reports
The Tivoli Performance Viewer (TPV) provides five different summary reports that make important data quickly and easily accessible. View summary reports to help you find performance bottlenecks in your applications and modules. The TPV summary reports are generated upon request and are not dynamically refreshed.
This is how the summary report for my HelloWorld EAR looks like, i made 3 calls to HelloWorldServlet which resulted in 3 calls to sayHello() method of HelloWorldEJB, this method show those three calls along with response time for each one of them and average response time
The TPV has following five summary reports
- Servlet report: show the no of calls and their average and total response time to all the servlets and JSPs. This is same as the current activity report
- EJBs: Shows the calls made to EJB, ejb method that is getting called and response times
- EJB Methods:Displays same data as that of EJBs report but in different format
- Connection Pool: Displays utilization of Data Source connection pools for each of the connection in graphical format
- Thread Pool: Displays utilization of various thread pools on the server such as web server, ORB thread pool.. in graphical format
Performance tunning for TPV
When you use TPV it adds performance overhead on the server. You can configure the TPV settings to manage the performance of the server. TPV monitors the performance activity of all servers on a node. You can configure the activity monitoring of TPV on a per-user basis. Any changes made to TPV settings are only for the server being monitored and only affect the user viewing the data.
The values you set for Refresh Rate and Buffer Size depend on your use of TPV. To diagnose a known problem on a test machine, you might poll data more frequently while having a decreased buffer size. To monitor a production server, you might poll data less frequently and specify a buffer size depending on how much history you want. However, TPV is not intended to be a full-time monitoring solution
- Refresh Rate: Specifies how frequently TPV collects performance data for a server from the Performance Monitoring Infrastructure (PMI) service provided by that server. The default is 30 seconds. To collect performance data for the server more frequently, set the refresh rate to a smaller number. To collect performance data less frequently, set the refresh rate to a larger number. The allowed range is 5 to 500 seconds.
- Buffer Size: Specifies the number of entries to be stored for a server. Data displayed in TPV is stored in a short in-memory buffer. After the buffer is full, each time a new entry is retrieved the oldest entry is discarded. The default buffer size is 40 entries. Supported values are 10, 20, 30, 40, 50, 60, 70, 80, 90 and 100. The larger the buffer size, the more memory is consumed. Thus, specify a buffer size that allows you capture enough monitoring data for analysis without wasting memory storing unneeded data.
- View data as: Specifies how counter values are displayed.
The values you set for Refresh Rate and Buffer Size depend on your use of TPV. To diagnose a known problem on a test machine, you might poll data more frequently while having a decreased buffer size. To monitor a production server, you might poll data less frequently and specify a buffer size depending on how much history you want. However, TPV is not intended to be a full-time monitoring solution
Viewing current performance activity
Log into the WAS Admin Console and go to Monitor and Tuning -> Performance Viewer -> Current Activity, then select the server which you want to monitor, on this page it displays two parts first on the left hand side it has links to all the TPV modules such as Advisor, Summary Report,.. and on the right hand side it displays the current activity on the server
In order to check what data is displayed in the current activity page, i created a simple HelloWorld.ear. It has a HelloWorldServlet, that makes a call to HelloWorldEJB and then forwards control to index.jsp for generating response. I made 3 requests to the HelloWorldServlet and this is the data that was displayed in the current activity
It displays how many requests were made to the HelloWorldServlet and what is average response and total response time for each of the request. The HelloWorldServlet forwards control to index.jsp for actual markup generation so calls to index.jsp are also monitored and recorded here i.e. each jsp is considered as a servlet
This data is similar to the Summary Report -> Servlet report. The data related to web application gets reset if you update the application and only those applications that you access after starting the server are displayed in the current activity
Tivoli performance viewer (TPV)
Tivoli performance viewer (TPV) enables administrators and programmers to monitor the overall health of WebSphere Application Server from within the administrative console. It provides simpler viewer for the performance data collected by WebSphere PMI
You can use TPV to
You can access the TPV by logging into WAS Admin Console and then going to Monitoring and Tuning -< Performance Viewer -< Current Activity
You can use TPV to
- View current activity
- View summary reports
- Log PMI performance data
You can access the TPV by logging into WAS Admin Console and then going to Monitoring and Tuning -< Performance Viewer -< Current Activity
PMI Data collection
PMI data collection can occur in three different interfaces
- JMX Interface: JMX interface is part of the J2EE specification and the recommended way to gather WebSphere Application Server performance data. PMI data can be gathered from the J2EE managed object MBeans or the WebSphere Application Server PMI Perf MBean. While the J2EE MBeans provide performance data about the specific component, the Perf MBean acts as a gateway to the WebSphere Application Server PMI service, and provides access to the performance data for all the components.
- Performance Servlet: Performance Servlet provides a way to use an HTTP request to query the PMI data for the entire WebSphere Application Server administrative domain. Since the servlet provides the performance data through HTTP, issues such as firewalls are trivial to resolve. The performance servlet outputs the PMI data as an XML document.
- PMI client API (deprecated): PMI client API provides a wrapper class to deliver PMI data to a client. This API was introduced in WebSphere Application Server, Version 4.0 and deprecated in V6.0. The PMI client API uses the JMX infrastructure and the Perf MBean to retrieve the PMI data. PMI client provides the data using a WebSphere Application Server-specific data structure that was introduced in V4.0.
Back up your application data.
This category covers the data stores used by your WebSphere Application Server applications. Unless your applications serve only static information, these resources are usually quite dynamic. You should back these up the same way you back up other business data on your system. These resources are suited for inclusion in a regularly scheduled backup.
For session recovery support, WebSphere Application Server provides distributed session support in the form of database sessions. You can use session recovery support when the user's session data must be maintained across a server restart or when the user's session data is too valuable to lose through an unexpected server failure.
All the attributes set in a session must implement java.io.Serializable if the session requires external storage. In general, consider making all objects held by a session serialized, even if immediate plans do not call for session recovery support. If the Web site grows, and session recovery support becomes necessary, the transition occurs transparently to the application if the sessions only hold serialized objects. If not, a switch to session recovery support requires coding changes to make the session contents serialized.
Taking backup of installed application
Exporting applications enables you to back up your applications and preserve binding information for the applications. You might export your applications before updating installed applications or migrating to a later version of the product.
To export applications, use the Export button on the Enterprise Applications page. Using Export produces an enhanced enterprise archive (EAR) file that contains the application as well as the deployment configuration. The deployment configuration consists of the deployment.xml and other configuration files that control the application behavior on a deployment target.
You can restore the backed up application any time using the WAS Admin Console using either the update or install button on Enterprise application button.
The application that you export this way is called enhanced enterprise application and this is how its content would look like
The deployment.xml has the binding information, this is how the sample deployment.xml looks like
<?xml version="1.0" encoding="UTF-8"?>
<appdeployment:Deployment xmi:version="2.0" xmlns:xmi="http://www.omg.org/XMI" xmlns:appdeployment="http://www.ibm.com/websphere/appserver/schemas/5.0/appdeployment.xmi" xmi:id="Deployment_1251509953840">
<deployedObject xmi:type="appdeployment:ApplicationDeployment" xmi:id="ApplicationDeployment_1251509953840" deploymentId="0" startingWeight="1" binariesURL="$(APP_INSTALL_ROOT)/dmgrCell01/perfServletApp.ear" useMetadataFromBinaries="false" enableDistribution="true" createMBeansForResources="true" reloadEnabled="false" appContextIDForSecurity="href:dmgrCell01/perfServletApp" filePermission=".*\.dll=755#.*\.so=755#.*\.a=755#.*\.sl=755" allowDispatchRemoteInclude="false" allowServiceRemoteInclude="false">
<targetMappings xmi:id="DeploymentTargetMapping_1251509953856" enable="true" target="ServerTarget_1251509953856"/>
<classloader xmi:id="Classloader_1251509953856" mode="PARENT_FIRST"/>
<modules xmi:type="appdeployment:WebModuleDeployment" xmi:id="WebModuleDeployment_1251509953856" deploymentId="1" startingWeight="10000" uri="perfServletApp.war">
<targetMappings xmi:id="DeploymentTargetMapping_1251509953857" target="ServerTarget_1251509953856"/>
<classloader xmi:id="Classloader_1251509953857"/>
</modules>
</deployedObject>
<deploymentTargets xmi:type="appdeployment:ServerTarget" xmi:id="ServerTarget_1251509953856" name="server1" nodeName="dmgrNode01"/>
</appdeployment:Deployment>
restoreConfig command
Use the restoreConfig command to restore the configuration of your node after backing up the configuration using the backupConfig command.By default, all servers on the node stop before the configuration restores so that a node synchronization does not occur during the restoration. If the configuration directory already exists, it is renamed before the restoration occurs. If you directly make changes to the application files in the app_server_root/installedApps directory, a process known as "hot deployment", but do not make the same changes to the application files in the app_server_root/config directory, the changes might be overwritten if you use the restoreConfig command.
I tried restoring the configuration from WAS_DM_08_28_2009.zip file on my DMGR it took couple of minutes to execute this command
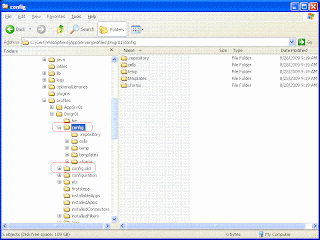
Now if i look at my DMGR_PROFILE directory i can see that the config directory before i executed restoreConfig command was renamed to config.old and the content of WAS_DM_08_28_2009.zip file was expanded into config directory
backupConfig command
The backupConfig command is a simple utility to backup the configuration of your node to a file. Before executing this command make sure that your configuration is in the consistent state and then synchronize to all the nodes.
When you execute backupConfig command it will storp the node before backup is made so that partically synchronized information is not saved so you can specify -nostop command line parameter so that the backup is taken without stopping the server
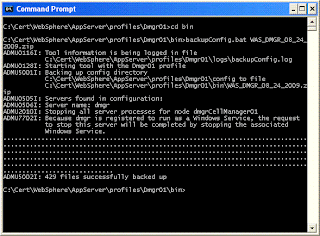
I took backup of my DMGR and it took couple of minutes to execute
After backup was taken i looked at the WAS_DMGR_08_24_2009.zip and this is how its content looks like
As you can see it took backup of PROFILE_HOME/config directory
Back up and restore Admin configuration
Websphere application server represents its administration configuration as XML files. You should back up the configuration on regular basis as well as before your make any big changes in the configuration. You can restore configuration from backed up file only if the WAS version is not chnaged i.e. WAS version at the time you backed up configuration should be same as that the time when you restored configuration.
Websphere provides following commands that you can use to back up and restore configuration
- backupConfig: Can be used to back up configuration
- restoreConfig: Can be used to restore configuration
Default Profile
Profiles use concept of default profile when more than one profile exists. The default profile is set to be the default target for scripts that do not specify a profile.
Lets say you have a DMGR and Application Server profile installed on your machine. Now if you want to start the Application Server you have two options either you can go to
You can find out the default profile for the installation by executing
You can set the default profile for an installation in multiple ways
Lets say you have a DMGR and Application Server profile installed on your machine. Now if you want to start the Application Server you have two options either you can go to
<APPSERVER_PROFILE_HOME>/bin
and execute startServer command or you can go to <APPSERVER_HOME>/bin
directory and execute startServer command and specify -pforileName <APPSERVER_PROFILE_NAME>
command line parameter.You can find out the default profile for the installation by executing
manageProfile.bat -getDefaultName
commandYou can set the default profile for an installation in multiple ways
- Using the manage profile command line tool by executing
manageProfile.bat -setDefaultName AppSrv01
command - At the time of creating new profile using Profile Management tool you can check the checkbox for Make this profile the default
What is profile
A profile defines the runtime environment. The profile includes all the files that the server processes in the runtime environment and that you can change. You can create profile using manageprofiles command or the Profile Management tool graphical user interface.
When you create a new profile, a new folder for the profile will get created in profiles folder but all the profiles for given application server installation share same binary. So if you update the application server version it will affect all the profiles. This makes administration little easier because you can update multiple servers by updating the binaries but disadvantage of using profiles is that you cant have different versions of the application server.
Each profile has its own administrative console and administrative scripting interface. The installation program for WebSphere Application Server uses the manageprofiles command to create a profile named default.
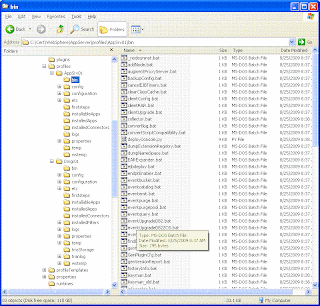
This how the directory structure of typical profile looks like
Invoking Installation Verification Tool
Graphically
When your installing the WebSphere Application Server, after installing the product there is check box that you can check to launch the First Steps wizard. The first link on the Installation verification, click on that link to invoke the Installation Verification tool
There are multiple ways in which you can invoke Installation Verification tool
Once you invoke the tool, it will open a log window and write message into it. Make sure that you see "Installation Verification Tool Installation Succeeded" message
If you forget to launch first Step at the time of install you can always launch that tool by invoking
<PROFILE_HOME>\firststeps\firststeps.bat
Command Line
You can run the installation verification tool from the command line by going to
<PROFILE_HOME>/bin
directory and executing ivt.bat <SERVER_NAME> <PROFILE_NAME>
command. It will write the output on the verification test on Console. The install verification tool writes the log messages in
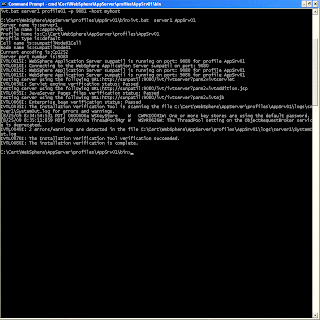
<PROFILE_HOME>/logs/ivtClient.log
file. This is how the sample log looks like
Server name is:server1
Profile name is:AppSrv01
Profile home is:C:\Cert\WebSphere\AppServer\profiles\AppSrv01
Profile type is:default
Cell name is:sunpatilNode01Cell
Node name is:sunpatilNode01
Current encoding is:Cp1252
Server port number is:9080
IVTL0015I: WebSphere Application Server sunpatil is running on port: 9080 for profile AppSrv01
IVTL0010I: Connecting to the WebSphere Application Server sunpatil on port: 9080
IVTL0015I: WebSphere Application Server sunpatil is running on port: 9080 for profile AppSrv01
Testing server using the following URL:http://sunpatil:9080/ivt/ivtserver?parm2=ivtservlet
IVTL0050I: Servlet engine verification status: Passed
Testing server using the following URL:http://sunpatil:9080/ivt/ivtserver?parm2=ivtAddition.jsp
IVTL0055I: JavaServer Pages files verification status: Passed
Testing server using the following URL:http://sunpatil:9080/ivt/ivtserver?parm2=ivtejb
IVTL0060I: Enterprise bean verification status: Passed
IVTL0035I: The Installation Verification Tool is scanning the file C:\Cert\WebSphere\AppServer\profiles\AppSrv01\logs\server1\SystemOut.log for errors and warnings.
[8/25/09 8:34:54:531 PDT] 0000000a WSKeyStore W CWPKI0041W: One or more key stores are using the default password.
[8/25/09 8:35:11:859 PDT] 0000000a ThreadPoolMgr W WSVR0626W: The ThreadPool setting on the ObjectRequestBroker service is deprecated.
IVTL0040I: 2 errors/warnings are detected in the file C:\Cert\WebSphere\AppServer\profiles\AppSrv01\logs\server1\SystemOut.log
IVTL0070I: The Installation Verification Tool verification succeeded.
IVTL0080I: The installation verification is complete.
Installation Verification Tool
Installation Verification tool(IVT) can be used to verify the installation of product and the Application server or Deployment manager profile. You can run the Install verification tool after installing product (With either DMGR or AppServer) profile, or after creating DMGR or AppServer profile. The IVT tool makes sure that the server process can start.
The install verification tool works differently depending on the type of profile that your verifying, If you are trying to verify a Deployment Manager, it will check that if DMGR is started if not it will start the DMGR and check if there are any errors in SystemOut.log or SystemErr.log.
If your trying to verify application server profile then it will check if the application server is started, if not start it. Once the server is started it will make requests to ivt servlet to verify that it can respond to request for servlet, JSP and EJB. In addition to that it will scan SystemOut.log and SystemErr.log to make sure that there are no errors.
No installation verification is possible for a custom profile. After federating the node and using the deployment manager to create a server, you can start the server process to verify its functionality.
Stoping distributed environment
Follow these sequence of steps to stop the distributed environment
- Go to each node machines and go to <NODE_PROFILE_HOME>/bin directory and execute stopServer command to first stop the application server on that node
- Inside the <NODE_PROFILE_HOME>/bin directory, execute stopNode command to stop node agent on that machine
- Go to the <DMGR_PROFILE_HOME>/bin directory and execute stopManager command to stop the deployment manager
Starting distributed environment
An orderly process for starting distributed environment is as follows
- Go to the <DMGR_PROFILE_HOME>/bin directory and execute
startManager.sh/.bat
command to start the deployment manager - If there are any errors in starting deployment manager check <profile_home>/logs/dmgr/SystemOut.log file
- Then go to each node and go to <Node_HOME>/bin directory and execute
startNode.sh/.bat
command to start the deployment manager - If there are any errors in starting deployment manager check <profile_home>/logs/nodeagent/SystemOut.log file
- On each node go to the <NODE_HOME>/bin directory and execute
startServer.sh/.bat
command to start the server - If there are any errors in starting deployment manager check <profile_home>/logs/server/SystemOut.log file
Profiles Types
The profiles are created based on templates supplied with the product. These templates are located in
<was_home>/profileTemplates
. Each template consists of a set of files that provide the initial settings for the profile and a list of actions to perform after the profile is created. Currently, there is no provision for modifying these templates for your use, or for creating new templates. When you create a profile using manageprofiles, you will need to specify one of the following templates:- default (for application server profiles)
- dmgr (for deployment manager profiles)
- managed (for custom profiles)
- cell (for cell profiles)
Profiles Notes
The WAS installation process simply lays down a set of core product files required for the run time process. After installation, you need to create one or more profiles that define the run time to have functional system.
With Base and Express, you can only have stand-alone application servers. Each application server is defined within a single cell and node. The administration console is hosted within the application server and can only connect to that application server. No central management of multiple application servers is possible. An application server profile defines this environment. You can also create stand-alone application servers with the Network Deployment package, though you would most likely do so with the intentof federating that server into a cell for central management.
With the Network Deployment package, you have the option of defining multiple application servers with central management capabilities. The administration domain is the cell, consisting of one or more nodes. Each node contains one or more application servers and a node agent that provides an administration point management by the deployment manager. The deployment manager can be located on the same machine as one or more of the application servers
The basis for this run time environment starts with the deployment manager that provides the administration interface for the cell. As you would expect, thedeployment manager is defined by a deployment manager profile.
If there are any errors at the time of creating profile you can check the logs at
<was_home>/logs/managedprofiles/<profile_home>_create.log
You can find the detailed logs for each of the action executed during profile creation in <was_home>/logs/managedprofiles/<profile_home> folder
Persistence session management
By default, WebSphere places session objects in memory. However, the administrator has the option of enabling persistent session management, which instructs WebSphere to place session objects in a persistent store. There are two ways to configure session persistence in WebSphere Application Server V6
- Database persistence
- Memory-to-memory session state replication using the data replication
service available in distributed server environments
Fail Over
Server clusters provide a solution for failure of an application server. Sessions created by cluster members in the server cluster share a common persistent session store. Therefore, any cluster member in the server cluster has the ability to see any user’s session saved to persistent storage. If one of the cluster members fail, the user can continue to use session information from another cluster member in the server cluster. This is known as failover. Failover works regardless of whether the nodes reside on the same machine or several machines
After a failure, WebSphere redirects the user to another cluster member, and the user’s session affinity switches to this replacement cluster member. After the initial read from the persistent store, the replacement cluster member places the user’s session object in the in-memory cache, assuming the cache has space available for additional entries.
The Web server plug-in maintains the cluster member list in order and picks the cluster member next in its list to avoid the breaking of session affinity. From then on, requests for that session go to the selected cluster member. The requests for the session go back to the failed cluster member when the failed cluster member restarts.
Session Affinity
The Servlet Specification 2.4 requires that HTTP session be
Accessible only to the web application that created the session. The Session ID but not the session data, can be shared across Web Applications.
Handled by a single JVM for that application at any one time.
In a clustered environment, any HTTP requests associated with an HTTP session must be routed to the same Web application in the same JVM. This ensures that all of the HTTP requests are processed with a consistent view of the user’s HTTP session. The exception to this rule is when the cluster member fails or has to be shut down.
WebSphere is able to assure that session affinity is maintained in the following way: Each server ID is appended to the session ID. When an HTTP session is created, its ID is passed back to the browser as part of a cookie or URL encoding. When the browser makes further requests, the cookie or URL encoding will be sent back to the Web server. The Web server plug-in examines the HTTP session ID in the cookie or URL encoding, extracts the unique ID of the cluster member handling the session, and forwards the request.
The JSESSIONID cookie can be divided into four parts: cache ID, session ID, separator, clone ID, and partition ID (new in V6). JSESSION ID will include a partition ID instead of a clone ID when memory-to-memory replication in peer-to-peer mode is selected. Typically, the partition ID is a long numeric number.
For example the JSESSIONID cookie value of 0000HHAnbYWnNxGD-iVupvcArfr:14dtuueci is made up of these four parts
- Cache ID 0000
- Session ID: HHAnbYWnNxGD-iVupvcArfr
- separator :
- Clone ID: 14dtuueci
URL Rewriting for session tracking
URL rewriting works by storing the session identifier in the page returned to the user. WebSphere encodes the session identifier as a parameter on URLs that have been encoded programmatically by the Web application developer. This is an example of a Web page link with URL encoding:
When the user clicks this link to move to the /store/catalog page, the session
identifier passes into the request as a parameter.
URL rewriting requires explicit action by the Web application developer. If the servlet returns HTML directly to the requester, without using a JavaServer Page, the servlet calls the API
The fact that the servlet or JSP developer has to write extra code is a major drawback over the other available session tracking mechanisms. URL rewriting limits the flow of site pages exclusively to dynamically generated pages, such as pages generated by servlets or JSPs. WebSphere inserts the session ID into dynamic pages, but cannot insert the user’s session ID into static pages, .htm, or .html.
Therefore, after the application creates the user’s session data, the user must visit dynamically generated pages exclusively until they finish with the portion of the site requiring sessions. URL rewriting forces the site designer to plan the user’s flow in the site to avoid losing their session ID.
<a href="/store/catalog;$jsessionid=DA32242SSGE2">
When the user clicks this link to move to the /store/catalog page, the session
identifier passes into the request as a parameter.
URL rewriting requires explicit action by the Web application developer. If the servlet returns HTML directly to the requester, without using a JavaServer Page, the servlet calls the API
out.println("<a href=\");
out.println(response.encodeURL ("/store/catalog"));
out.println("\>catalog</a>");
The fact that the servlet or JSP developer has to write extra code is a major drawback over the other available session tracking mechanisms. URL rewriting limits the flow of site pages exclusively to dynamically generated pages, such as pages generated by servlets or JSPs. WebSphere inserts the session ID into dynamic pages, but cannot insert the user’s session ID into static pages, .htm, or .html.
Therefore, after the application creates the user’s session data, the user must visit dynamically generated pages exclusively until they finish with the portion of the site requiring sessions. URL rewriting forces the site designer to plan the user’s flow in the site to avoid losing their session ID.
Setting permenanet cookies using WebSphere Application Server
By default the value of Cookie Maximum age is set to Current browser session, so what that means is that the HttpSession is maintained in the browsers memory and stays there till the users browser is open. And when user browser is closed the HTTPSession information is lost, so if user browser is closed or crashed for some reason, if he opens a new browser his HTTP Session information will be lost and user will have to login again.
You might have a business requirement, where you might want to maintain users session across multiple browser session. Ex. you might want to remember user for next 10 days. In that case you can Check the Set Maximum age radio button and set maximum age to say 864000 seconds.
After you made that change when user logs in you can generate his HTTPSession object and when the JSESSIONID cookie is sent it will look like this. Did you see the Expiration time is set to after 10 days.
Now close your browser and restart new instance, if you go to show cookies you will notice that the JSESSIONID generated for user is still there. Now if user makes any request to localhost before the cookie is expired then browser will include this cookie in the request and on the server side you can use the JSESSIONID to identify the user and let him resume his work
Configuring Cookie based session tracking
If you decide to use Cookies for session tracking then you can configure that behavior by clicking on Enable cookies hot link, you will get a screen like this
In addition to that there are two more properties that you can configure Cookie Domain and Cookie Path, Before we talk about that we will have to cover how the cookies work, When user makes a request to the server for the first time, server will generate a HTTP Session and return that cookie to the browser. After that whenever browser is making request to server it includes that cookie in header so that server can find out the user based on that cookie. The way cookies work in browsers is that you can limit the requests to which browser will forward the cookie Ex. lets say your environment you have public.webspherenotes.com and private.webspherenotes.com, and you configured your cookie domain to private.webspherenotes.com. Now if you go to webspherenotes.com server will generate cookie and send it to browser. Now if your browser is sending next request to webspherenotes.com it will check the domain of request if it is public.webspherenotes.com it wont include the cookie and that way server wont have any way of knowing that this request is coming from user1.
Same thing applies to cookie path, you can configure the path to say to say dynamic so that browser will include cookie when making request to www.webspherenotes.com/dynamic but not when you make request to www.webspherenotes.com/images or www.webspherenotes.com/js
- Cookie Name: As per Servlet specification 2.4 the cookie name should be
JSESSIONID
. But you can change the cookie name - Restrict cookies to HTTP Session: Enabling this feature restricts the exchange of cookies only to HTTPS sessions.
- Cookie maximum age: The amount of time that the cookie will live in the client browser. There are two choices:
- Expire at the end of the current browser session
- Expire at a configurable maximum age
If you choose the maximum age option, specify the age in seconds.
In addition to that there are two more properties that you can configure Cookie Domain and Cookie Path, Before we talk about that we will have to cover how the cookies work, When user makes a request to the server for the first time, server will generate a HTTP Session and return that cookie to the browser. After that whenever browser is making request to server it includes that cookie in header so that server can find out the user based on that cookie. The way cookies work in browsers is that you can limit the requests to which browser will forward the cookie Ex. lets say your environment you have public.webspherenotes.com and private.webspherenotes.com, and you configured your cookie domain to private.webspherenotes.com. Now if you go to webspherenotes.com server will generate cookie and send it to browser. Now if your browser is sending next request to webspherenotes.com it will check the domain of request if it is public.webspherenotes.com it wont include the cookie and that way server wont have any way of knowing that this request is coming from user1.
Same thing applies to cookie path, you can configure the path to say to say dynamic so that browser will include cookie when making request to www.webspherenotes.com/dynamic but not when you make request to www.webspherenotes.com/images or www.webspherenotes.com/js
Cookie for session tracking
Cookies is the most commonly used method for tracking user session. The way it works is WebSphere Application server's session support generates a unique session ID for each user, and returns this ID to the users browser with cookie. There after whenver browser is making requests browser would send that cookie in header to the server and whenver server is generating response it will send that cookie information in header to the browser. By default websphere uses temporary cookies i.e. cookie which is not written to users machine to store session information, the cookie gets destroyed if the browser is closed. The cookie holds session identifier but the actual session information is stored on the server. The default name of the session management cookie is JSESSIONID
Main disadvantage with cookies is taht some users, either by choice or mandage, disable them from within their browsers.
SSL ID Session Tracking
SSL Tracking is supported only for the IBM HTTP Server and SUN one Web Server.
When SSL ID tracking is enabled for requests over SSL, SSL session information is used to track the HTTP session ID. Since the SSL session ID is negoitated between the HTTP server and browser, it cannot survive the HTTP Server crash However, the failure of an application server does not affect the SSL session ID and if the distributed session is not enabled the session itself is lost.The lifetime of an SSL session ID can be controlled by configuration options in the Web server. In environments that use WebSphere Edge Server with multiple HTTP servers, you must use an affinity
mechanism when SSL session ID is used as the session tracking mechanism.
When the SSL session ID is to be used as the session tracking mechanism in a clustered environment, either cookies or URL rewriting must be used to maintain session affinity. The cookie or rewritten URL contains session affinity information that enables the Web server to properly route requests back to the same server once the HTTP session has been created on a server. The SSL ID is not sent in the cookie or rewritten URL but is derived from the SSL information.
The main disadvantage of using SSL ID tracking is the performance hit of using SSL. If you have a business requirement to use SSL, then this would be a good choice. If you do not have such a requirement, it is probably a good idea to consider using cookies instead.
SessionInspectServlet
WebSphere Application Server Ships
You might want to use this when you start getting NotSerializableException or you run into performance issue due to size of data stored in session.
You can follow these steps to add SessionInspectorServlet to your web application
com.ibm.ws.webcontainer.httpsession.SessionInspectServlet
servlet that you can use to investigate what content is stored in HttpSession of your application. The SessionInspectServlet will tell you- Names of the session attributes
- Size of the data in session attribute
- If the attribute is serializable or not
You might want to use this when you start getting NotSerializableException or you run into performance issue due to size of data stored in session.
You can follow these steps to add SessionInspectorServlet to your web application
- Add Session Inspector servlet to web.xml file of your web application
<servlet>
<display-name>SessionInspectServlet</display-name>
<servlet-name>SessionInspectServlet</servlet-name>
<servlet-class>com.ibm.ws.webcontainer.httpsession.SessionInspectServlet</servlet-class>
</servlet>
<servlet-mapping>
<servlet-name>SessionInspectServlet</servlet-name>
<url-pattern>/SessionInspectServlet</url-pattern>
</servlet-mapping>
You dont have to include any jars in your web application. If you search for SessionInspectServlet class you will notice that it is part of WebSphere/AppServer/plugins/com.ibm.ws.webcontainer_2.0.0.jar, which is websphere runtime so you can use that class without including it in your web application - Install and start your web application on server
- Access the SessionInspectorServlet by going to /webcontext/SessionInspectorServlet url
This is the output that i get for my webapplication, i am storing object of Contact class in session that does not implement Serializable interface and a String, String is serializable
Shared Session Context
The Servlet specification defines session scope at the Web Application level, session information stored by one web application cannot be shared by other web applications even in the same enterprise application.WebSphere Application Server provides an IBM extension, that allows sharing the session information to be shared among web applications within an enterprise application. This option is offered as an extension to the application deployment descriptor.
In order to try this scenario i tried creating a Simple SessionContextSampleEAR. It has two .war files and each .war file has one servlet each. I am setting the session attribute in one servlet and accessing it in another and it works.
You can enalbe shared session context using RAD or IBM WAS Toolkit during the application assembly phase like this
Now if you check ibm-application-ext.xmi file in you .ear files META-INF folder you will see that value of sharedSessionContext attribute is set to true like this
<applicationext:ApplicationExtension xmi:version="2.0" xmlns:xmi="http://www.omg.org/XMI" xmlns:applicationext="applicationext.xmi" xmi:id="ApplicationExtension_1250896346141" sharedSessionContext="true">
<application href="META-INF/application.xml#Application_ID"/>
</applicationext:ApplicationExtension>
Session Management
- Application Server: This is the default level. Configuration at this level is applied to all Web modules within the server.
- Application: Configuration at this level is applied to all Web Modules within the web application
- Web Modules: Configuration at this level is applied only to the web application
The level at which you set a property decides the scope at which that property is assigned. You get the Session management link at all three levels and when you click on that link you will get a screen like this
WebSphere Application Server has set of Session properties that you can set at either of the following three levels
WAS allows you to set following session management properties
- Session tracking mechanism: WebSphere Application server provides following three mechanism to implement the session tracking
- Enable SSL ID Tracking:Specifies that session tracking uses Secure Sockets Layer (SSL) information as a session ID. Enabling SSL tracking takes precedence over cookie-based session tracking and URL rewriting.
- Enable Cookies: Specifies that session tracking uses cookies to carry session IDs. If cookies are enabled, session tracking recognizes session IDs that arrive as cookies and tries to use cookies for sending session IDs. If cookies are not enabled, session tracking uses Uniform Resource Identifier (URL) rewriting instead of cookies (if URL rewriting is enabled).
Enabling cookies takes precedence over URL rewriting. Do not disable cookies in the session management facility of the application server that is running the administrative application because this action causes the administrative application not to function after a restart of the server. As an alternative, run the administrative application in a separate process from your applications. Click Enable cookies to change these settings. - Enable URL Rewriting: Specifies that the session management facility uses rewritten URLs to carry the session IDs. If URL rewriting is enabled, the session management facility recognizes session IDs that arrive in the URL if the encodeURL method is called in the servlet.
server is allowed.
Enabling class loader viewer service
Starting with version 6.0.2, WAS introduced a new utility called the Class Loader Viewer. When activated, this utility can help you diagnose class loading problems by showing you the different class loaders involved, their settings, and the classes loaded by each of them. By default the Class Loader Viewer Service is not enabled, the Class Loader Viewer only displays the hierarchy of class loaders and their classpaths, but not the classes actually loaded by each of the class loaders. This also means that the search capability of the Class Loader Viewer is lost
You can enable the Class Loader Viewer utility using WAS Admin Console by going to the server details page of the server for which you want to enable the service. On that page click on Class Loader Viewer Service link
The Class Loader Viewer Service page has only one checkbox "Enable Service at server startup", check that check box. Save your changes and restart that server.
Application and Web Module class loader
EJB Modules, Utility JARS, resource adapter files and shared libraries associated with an application are alwasy grouped together into the same class loader. THis class loader is called as Application class loader. By default each .ear file gets its own class loader but if you want to use same class loader for all the enterprise applications in your server then you do that by setting valuse of classloader policy to Multiple on the server detail page
Each Web Module i.e. .war file receives their own class loader, a WAR classloader to load the contents of WEB-INF/classes and WEB-INF/lib directories. You can modify this so that single classloader i.e. class loader of the enterprise application is used for loading all the web modules in that enterprise application. You can change that on WAS Admin Console by selecting the Enterprise application that you want to change and clicking on its class loader link.
The application class loader is the parent of Web Module class loader. So web module can access EJB or utility classes but EJB cannot access your servlet
Restricting access to websphere non public API
WebSphere Application Server V6.1 gives you the ability to restrict access to internal WebSphere classes so that your applications do not make unsupported calls to WebSphere classes not published in the official WebSphere Application Server API. This setting is a per-server (JVM) setting called Access to internal server classes
You can change this setting from WAS Admin Console, on server details page like this
The default setting is Allow, meaning that your applications can make unrestricted calls to non-public internal WebSphere classes. This is not recommended and may be prohibited in future releases. Therefore, as an administrator, it is a good idea to switch this setting to Restrict to see if your applications still work. If they depend on non-public WebSphere internal classes you will receive a ClassNotFoundException, and in that case you can switch back to Allow. Your developers should then try to migrate their applications so that they do not make unsupported calls to the WebSphere internal classes in order to retain compatibility with future WebSphere Application Server releases
WebSphere Extension class loader
WebSphere Provides serveral custom delegated class loader as shown
The top part is Java Class loader, which is Java class loader. WebSphere loads just enough to get itself bootstrapped and initialize WebSphere extension class loader.
The WebSphere extensions class loader is where WebSphere itself is loaded. In previous versions of WebSphere, the run time was loaded by this single class loader. However, beginning with WebSphere Application Server V6.1, WebSphere is now packaged as a set of OSGi bundles. Each OSGi bundle is loaded separately by its own class loader. This network of OSGi class loaders is then connected to the extensions class loader and the rest of the class loader hierarchy through an OSGi gateway class loader
In previous versions of WebSphere Application Server the WebSphere run time classes files were stored in the classes, lib, lib\ext, and installedChannels directories in the <was_home> directory. Because of the OSGi packaging, these directories no longer exist and the run time classes are now stored in the <was_home>\plugins directory.
Despite this architectural change in the internals of how WebSphere loads its own classes, there is no behavioral change as far as your applications are concerned. They still have the same visibility, and the same class loading options still exist for your application.
On the other hand, if you have developed Java applications that rely on the WebSphere JAR files that were previously in the <was_home>\lib directory, you will need to modify your application to retain compatibility. WebSphere Application Server V6.1 provides two thin client libraries designed specifically for such applications: one administrative client library and one Web services client library. These thin client libraries can be found in the <was_home>\runtimes directory:
These libraries provide everything your application might need for connecting to and working with WebSphere
The class path used by the extensions class loader is retrieved from the ws.ext.dirs system property, which is initially derived from the WAS_EXT_DIRS environment variable set in the setupCmdLine script file.
The top part is Java Class loader, which is Java class loader. WebSphere loads just enough to get itself bootstrapped and initialize WebSphere extension class loader.
The WebSphere extensions class loader is where WebSphere itself is loaded. In previous versions of WebSphere, the run time was loaded by this single class loader. However, beginning with WebSphere Application Server V6.1, WebSphere is now packaged as a set of OSGi bundles. Each OSGi bundle is loaded separately by its own class loader. This network of OSGi class loaders is then connected to the extensions class loader and the rest of the class loader hierarchy through an OSGi gateway class loader
In previous versions of WebSphere Application Server the WebSphere run time classes files were stored in the classes, lib, lib\ext, and installedChannels directories in the <was_home> directory. Because of the OSGi packaging, these directories no longer exist and the run time classes are now stored in the <was_home>\plugins directory.
Despite this architectural change in the internals of how WebSphere loads its own classes, there is no behavioral change as far as your applications are concerned. They still have the same visibility, and the same class loading options still exist for your application.
On the other hand, if you have developed Java applications that rely on the WebSphere JAR files that were previously in the <was_home>\lib directory, you will need to modify your application to retain compatibility. WebSphere Application Server V6.1 provides two thin client libraries designed specifically for such applications: one administrative client library and one Web services client library. These thin client libraries can be found in the <was_home>\runtimes directory:
- com.ibm.ws.admin.client_6.1.0.jar
- com.ibm.ws.webservices.thinclient_6.1.0.jar
These libraries provide everything your application might need for connecting to and working with WebSphere
The class path used by the extensions class loader is retrieved from the ws.ext.dirs system property, which is initially derived from the WAS_EXT_DIRS environment variable set in the setupCmdLine script file.
Java Class Loader
When you start a JVM, you use three class loaders: the bootstrap class loader, the extensions class loader, and the application class loader.
The parent-delegation model is a key concept to understand when dealing with class loaders. It states that a class loader delegates class loading to its parent before trying to load the class itself. The parent class loader can be either another custom class loader or the bootstrap class loader. But what is very important is that a class loader can only delegate requests to its parent class loader, never to its child class loaders
- The bootstrap class loader is responsible for loading only the core Java libraries, that is vm.jar, core.jar, and so on, in the <JAVA_HOME>/jre/lib directory. This class loader, which is part of the core JVM, is written in native code.
- The extensions class loader is responsible for loading the code in the extensions directories (<JAVA_HOME>/jre/lib/ext or any other directory specified by the java.ext.dirs system property). This class loader is implemented by the sun.misc.Launcher$ExtClassLoader class.
- The application class loader is responsible for loading the code that is found on java.class.path, which ultimately maps to the system CLASSPATH variable. This class loader is implemented by the sun.misc.Launcher$AppClassLoader class.
The parent-delegation model is a key concept to understand when dealing with class loaders. It states that a class loader delegates class loading to its parent before trying to load the class itself. The parent class loader can be either another custom class loader or the bootstrap class loader. But what is very important is that a class loader can only delegate requests to its parent class loader, never to its child class loaders
WSAdmin Objects
The wsadmin command exposes following four objects
- AdminControl:The AdminControl scripting object is used for operational control. It communicates with MBeans that represent live objects running a WebSphere server process. It includes commands to query existing running objects and their attributes and invoke operations on the objects.
- AdminConfig: The AdminConfig object is used to manage the configuration information that is stored in the repository. This object communicates with the WebSphere Application Server configuration service component to make configuration inquires and changes. In a distributed server environment, the AdminConfig commands are available only if a scripting client is connected to the deployment manager. When connected to a node agent or a managed application server, the AdminConfig commands will not be available because the configuration for these server processes are copies of the master configuration that resides in the deployment manager.
- AdminApp: The AdminApp object can update application metadata, map virtual hosts to Web modules, and map servers to modules for applications already installed. Changes to an application, such as specifying a library for the application to use or setting session management configuration properties, are performed using the AdminConfig object.
- AdminTask: The AdminTask object is used to access a set of task-oriented administrative commands that provide an alternative way to access the configuration commands and the running object management commands. The administrative commands run simple and complex commands. The administrative commands are discovered dynamically when the scripting client is started. The set of available administrative commands depends on the edition of WebSphere Application Server you install. You can use the AdminTask object commands to access these commands.
WSAdmin command invocation
The wsadmin command can be invoked in three different ways
Rational application developer has a Jython development perspective that lets you develop and execute Jython commands from within IDE and it also lets you debug your script
In this screen shot i am executing createWASVariable.py script from IDE on my DMGR. I need to specify soap port of DMGR and Admin user login information here
- Invoking Single command: You can invoke single command of wsadmin by executing
wsadmin -c AdminControl.getNode()
- Invoking commands interactively: If you want to execute more than one command then you can execute wsadmin in interactive mode, This is the default mode of wsadmin and you can invoke it by not passing either -c or -f options. Once you do that the wsadmin prompt will appear and you can execute wsadmin scripting commands on the prompt.
- Running script file (-f): If you have set of predefined scripts then you can execute
wsadmin -f <filename>
command to execute the script file.
Rational application developer has a Jython development perspective that lets you develop and execute Jython commands from within IDE and it also lets you debug your script
In this screen shot i am executing createWASVariable.py script from IDE on my DMGR. I need to specify soap port of DMGR and Admin user login information here
WSAdmin security hardening
When you execute the wsadmin script you will have to pass the username and password for the user as command line parameter. But one of my client had this hardening requirement that we should not pass user name and password on command line because if someone is running ps at the same time they could see the command line parameters. Since i was writing automation script i could not prompt user for user name password. So i did set following things
- Change \profiles\AppSrv01\properties\soap.client.properties file,
set value of com.ibm.SOAP.loginUserid property to the userId of the admin user and value of com.ibm.SOAP.loginPassword property to the password of the admin user and then set value of com.ibm.SOAP.loginSource property to blank.
com.ibm.SOAP.loginUserid=wasadmin
com.ibm.SOAP.loginPassword=wasadmin
#------------------------------------------------------------------------------
# SOAP Login Prompt
#
# The auto prompting will happen only if all of the following are met:
#
# - Running from a SOAP client
# - Server is reachable and server security is enabled
# - Username and password are not provided either on command line or in this
# file
# - com.ibm.SOAP.loginSource below is set to either "stdin" or "prompt"
#
# stdin: prompt in command window
# prompt: GUI dialog box; falls back to stdin if GUI not allowed
#
# (So to disable auto prompting, set loginSource to nothing)
#------------------------------------------------------------------------------
com.ibm.SOAP.loginSource= - Now the password is set in plain text which is a security problem so you can use the PropFilePasswordEncoder utility to encode the admin user password in the soap.client.properties file.
View administrative script command for last action
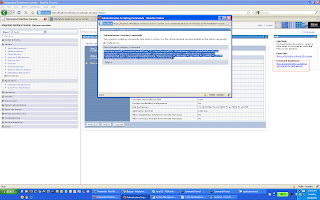
WebSPhere Application Server 6.1 has this cool feature, that when you perform some adminstrative action using the WAS Admin console, it will let you get the Wsadmin script command to for the action that you performed using WAS COnsole
I tried installing ConnectionLeak.Ear file and i used the default options for every thing, on the last screen of Install application wizard i saw "View administrative scripting command for last action" link on the right hand side. Clicking on that link generates the equivalent wsadmin command like this
I can save the command as a script file and then execute it from the command line. This feature is very helpful when your trying to automate administration, first you can perform the administrative command using WAS Admin console and then copy script, and parameterize it.
Subscribe to:
Posts (Atom)