Lets say during your performance testing you realized that something happens after the load reaches 100 users and the server hangs in next 5 min. Now when your running the test its difficult to look at all the statics or re-run the test several times. So what you can do is log the performance data at the time of running the test and then you can look at the data some later point of time.
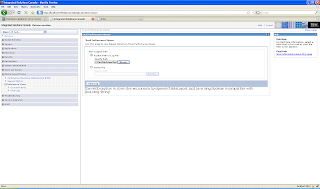
Before you start logging data go to the log related settings page to make sure that it has correct settings

After that i went to the current activity screen and started logging of PMI data by clicking on start logging button

Now start executing your performance test, in my case i did manually hit the HelloWorldServlet few times and then i clicked on stop logging button

Once you stop logging you will notice that there is a .zip file that got created in the profiles_home\logs\tpv folder that file has tpv performance data, so you can view that data using was admin console like this

When you click on view data, it will take you the TPV and start displaying the logged data, you will have option play, rewind stop from here

No comments:
Post a Comment