This is how the summary report for my HelloWorld EAR looks like, i made 3 calls to HelloWorldServlet which resulted in 3 calls to sayHello() method of HelloWorldEJB, this method show those three calls along with response time for each one of them and average response time
The TPV has following five summary reports
- Servlet report: show the no of calls and their average and total response time to all the servlets and JSPs. This is same as the current activity report
- EJBs: Shows the calls made to EJB, ejb method that is getting called and response times

- EJB Methods:Displays same data as that of EJBs report but in different format
- Connection Pool: Displays utilization of Data Source connection pools for each of the connection in graphical format
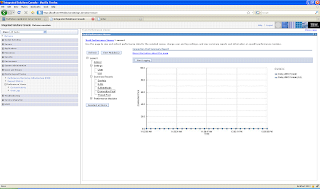
- Thread Pool: Displays utilization of various thread pools on the server such as web server, ORB thread pool.. in graphical format


No comments:
Post a Comment