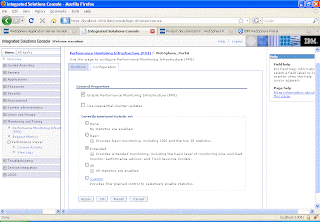
You can enable the PMI from either the WAS Admin Console or using wasadmin script. You can enable the PMI from WAS admin console by checking the Enable the Performance Monitoring Infrastructure checkbox like this

When PMI service is enabled, the monitoring of individual components can be enabled or disabled dynamically. PMI provides four predefined statistic sets that can be used to enable a set of statistics. The following table provides details about the statistic sets. If the predefined statistic sets does not meet your monitoring requirement, the Custom option can be used to selectively enable or disable individual statistics.
- None All statistics are disabled.
- Basic Statistics specified in J2EE 1.4, as well as top statistics like CPU usage and live HTTP sessions are enabled. This set is enabled out-of-the-box and provides basic performance data about runtime and application components.
- Extended Basic set plus key statistics from various WebSphere Application Server components like WLM and Dynamic caching are enabled. This set provides detailed performance data about various runtime and application components.
- All All statistics are enabled.
- Custom Enable or disable statistics selectively.
Important Note
To monitor performance data through the PMI interfaces, you must first enable PMI through the administrative console before restarting the server. If running in a Network Deployment environment, you must enable PMI on both the server and on the node agent before restarting the server and the node agent.
No comments:
Post a Comment